Representing paired pre/post data in an ordination with arrows using R and ggplot2 (CC428)
Riffomonas Project
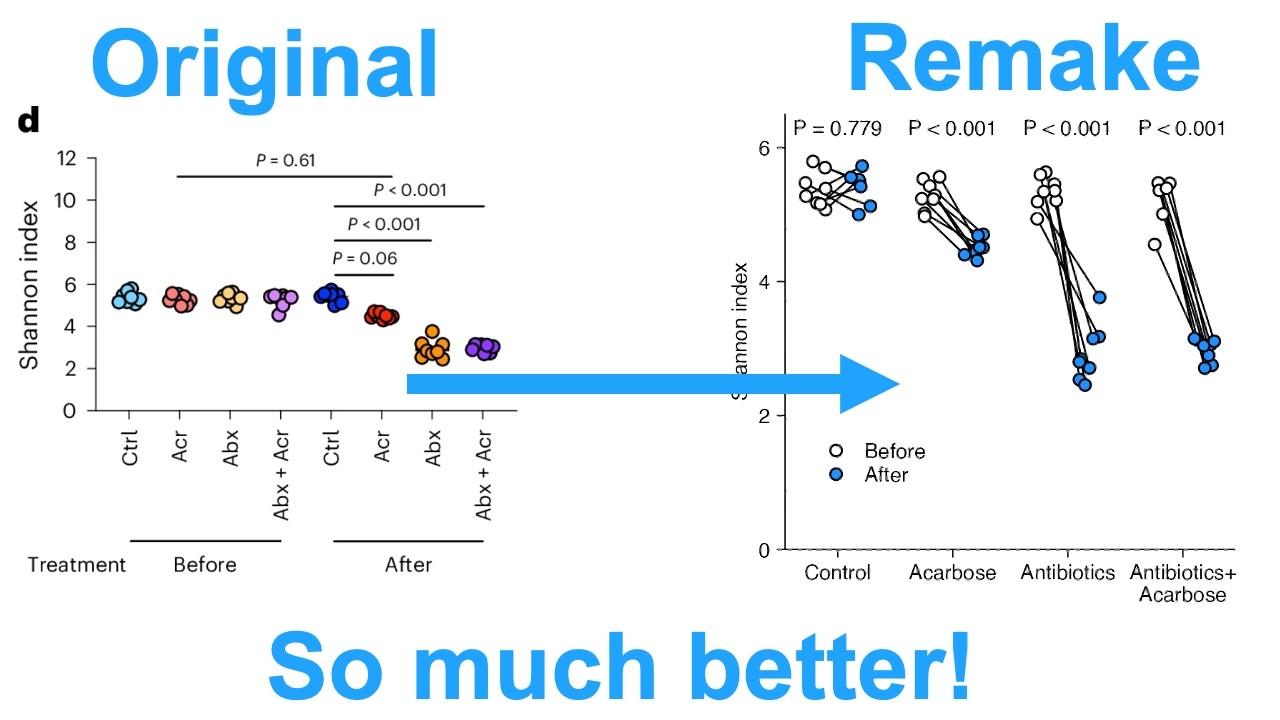
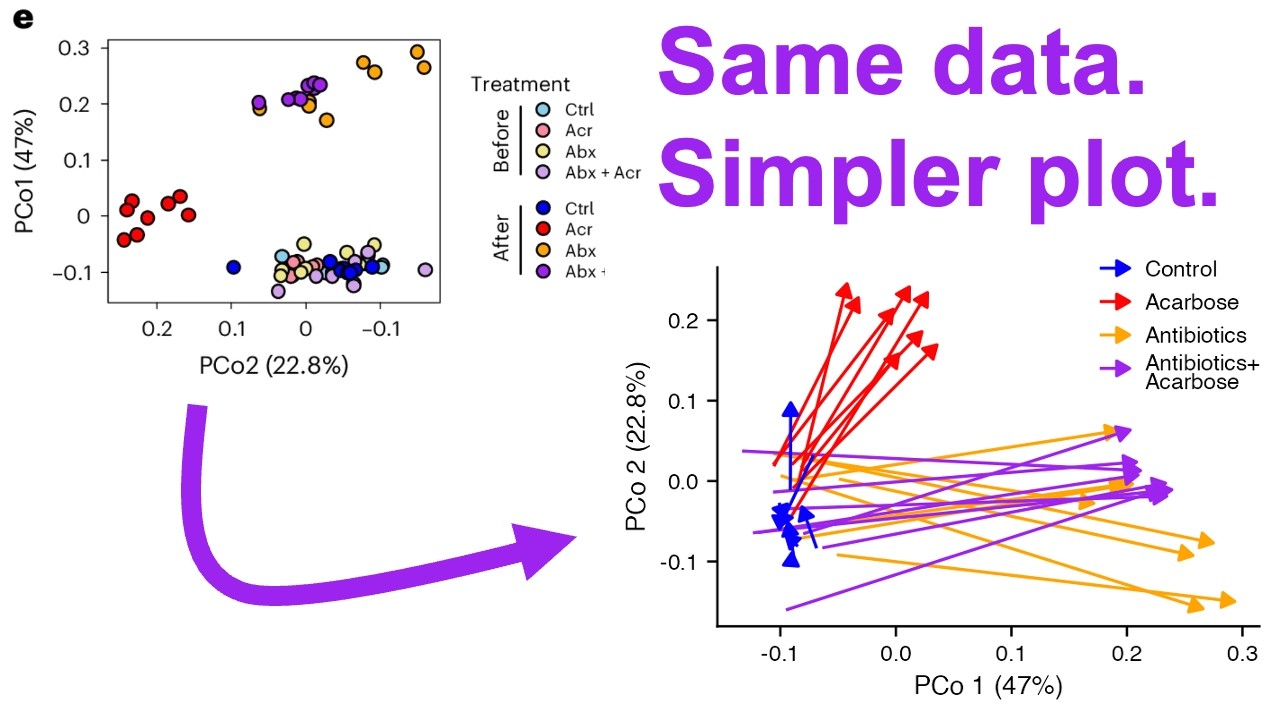
In this episode of Code Club, the host refactors a specific panel from a recent Nature Microbiology paper to better represent paired pre- and post-treatment data using R and ggplot2. The original figure displayed principal coordinate analysis results with structural issues, such as transposed axes w …