Week 7 - Lecture 33 : Machine Learning and Neural Networks in Prognostics
Watch on YouTubeVideo summary
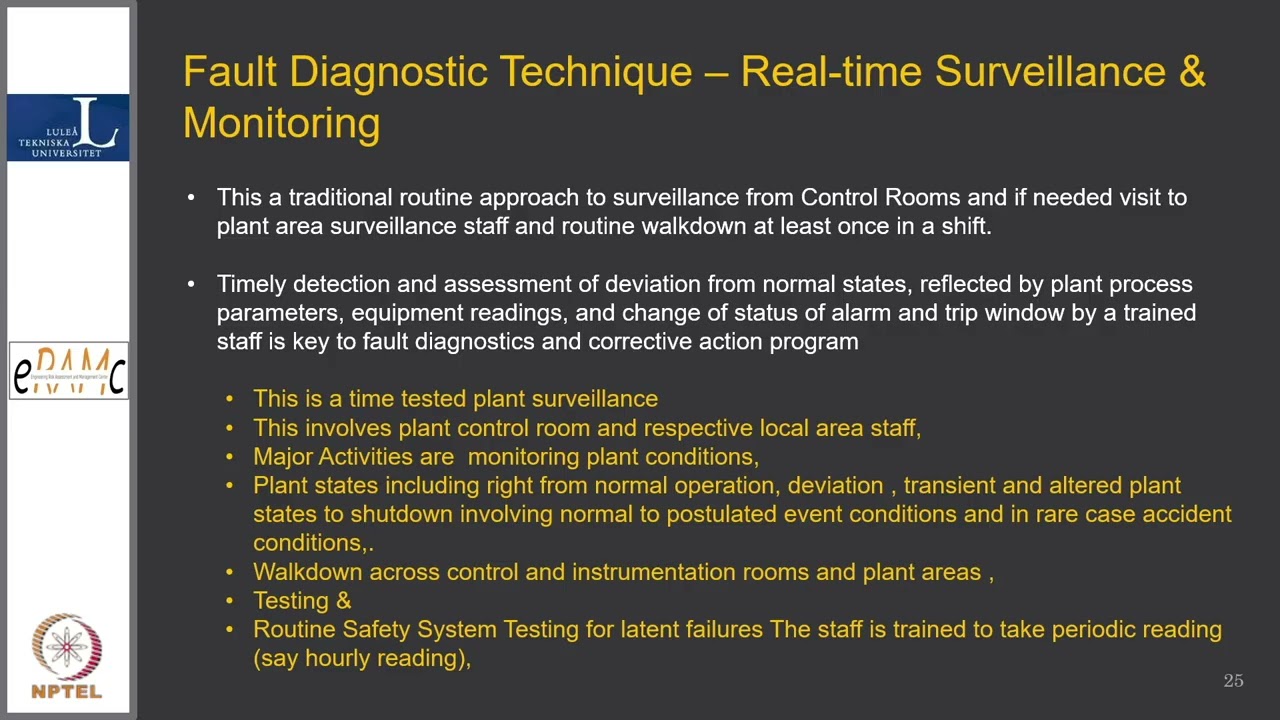
The lecture focuses on advanced fault diagnostic techniques, specifically real-time surveillance and monitoring, which serve as the foundation for machine learning algorithms in prognostics. The primary objective of these methods is to enable online data analysis that can predict component failures and guide operators on necessary corrective actions to ensure safe system operation. Real-time surveillance involves continuous monitoring of process parameters and equipment health from both central control rooms and local areas, where dedicated staff listen for anomalies like unusual noises or vibrations. When a parameter deviates from its expected steady state, triggering an audio-visual alarm, the immediate goal is to bring the plant back to a normal operating or shutdown state through minor corrective actions, such as restarting equipment or replacing failed electronic cards.
To manage complex systems where failures are inevitable but must be mitigated, the lecture introduces fault tree analysis and precursor analysis, which map events onto probabilistic risk assessment models to identify unsafe states. A critical concept discussed is common cause failure, where independent redundant components fail simultaneously due to shared vulnerabilities like flooding, fire, or electrical bus failures. The instructor illustrates this with a firefighting system example, showing how two redundant pump trains can still fail together if they share a single water tank, power supply, or are affected by human error during testing. By analyzing these dependencies using fault trees, engineers can develop production rules for expert systems that distinguish between independent failures and common cause failures, allowing for more robust diagnostic logic that accounts for environmental factors and human contributions.
The lecture further explores the Pareto analysis, often referred to as the 80/20 rule, which posits that 80% of domain-specific issues stem from 20% of the causes. This principle is central to fault tree inventory techniques, where ranking failures by probability allows analysts to prioritize resources on the most critical root causes. Using a fishbone diagram, various categories such as measurement errors, machine degradation (like bearing wear or corrosion), human error, and environmental conditions are mapped to their potential effects. By plotting failure data and applying Pareto analysis, organizations can identify that addressing just two major causes—such as power supply issues and bearing failures in the example provided—can resolve 80% of total injection failures, thereby optimizing maintenance strategies and reducing catastrophic risks without needing exhaustive investigation into every minor deviation.
Ultimately, these diagnostic tools transform qualitative observations and quantitative data into actionable rules for machine learning algorithms, bridging the gap between traditional safety engineering and modern prognostics. While current monitoring systems have limitations, they provide high coverage in industries ranging from chemical plants to nuclear facilities, ensuring that latent failures are detected before they escalate. The integration of fault tree knowledge with deep learning algorithms allows for a deeper understanding of subsystems, moving beyond surface-level component failures to investigate supporting systems like fuel and lubrication networks. This comprehensive approach ensures that when rare but severe events occur, the system can quickly infer the cause, assess the severity, and execute the correct procedure to maintain safety and operational continuity.
Read the full video transcript
[music]
So friends, we are into the third
lecture of the seventh week and uh we'll
continue discussing the fall diagnostic
techniques. So it is a fall diagnostics
part B and uh in the next lecture that
is fourth lecture we'll discuss um root
cause analysis uh which is uh uh very
very very useful technique when we have
a system which is very complicated uh
you know some sorry not complicated
complex systems uh and they have a high
stake in terms of uh their continuous
operation and they have high very high
stakes that they should operate very
safely. So let us discuss some more uh
techniques uh of fall diagnosis because
eventually what is our objective it
these techniques should be uh operating
as a procedure in a machine learning
algorithm that means online data and
then it will tell you that component if
component fails how that is something
like operator advisory system uh what
how how we can correct it how we can
avoid the failure uh or uh what action
to be needed um and what you should
check to perform a uh a correct uh
diagnostics and draw the inference of
course. So uh uh the scope of this
lecture remains into uh realtime
surveillance and monitoring. uh I have
firsthand experience of realtime
surveillance and monitoring though it
may be having some limitation because
these are the techniques they have born
uh with um the advanced systems like uh
uh process system uh
and then you know um chemical systems,
nuclear systems and then uh transport
systems uh so and I think the society
got benefited uh through uh through
realtime surveillance and monitoring um
um because uh they enable very high
coverage
in a train. You'll find an operator uh
operator uh cabin where he keeps
monitoring the system uh operating
parameter and safety parameter.
Similarly, in a plant control room of a
process or chemical or nuclear industry,
a person monitors the process parameters
and some of the direct equipment
parameters, their health and all. So, um
but then there is always uh always to go
or learn and improve the system. So we
have this fult tree inventory uh
technique uh that we uh have and then uh
in fultry eventries um from a huge
document these inferences are drawn and
they are converted into the rules um and
suppose these are quant this could be
quantified qualitative both and then
fishbond diagram and we have been seeing
in our reliability or management
literature uh these are the diagnostic
tool They are also called cause and
effect tools. Uh precursor analysis. It
has got its origin somewhere in the
probabistic risk assessment. That means
whatever event has happened, we should
be able to map it on a P model uh of the
plant and we should see whether it is
having any uh trace of contribution to
the uh plant unsafe states you know uh
and that will tell us which category of
diagnostics or prognostic should be
performed on for this. If it has a
serious consequences then we have to
have a serious consequence and I'll show
you uh what are the level of detail that
need to be investigated.
Parental analysis is there in one word
if somebody has to define it is a 8020
rule which is imple implemented for
cause and effect type of uh uh subjects
you know.
So um real time surveillance um let me
spend some time on this slide uh what I
am trying to put it because in
literature you won't find this in a
formal way um being talked about in a or
delivered as a lecture actually. So we
can say the present mode of monitorings
they are either from control room of the
plant or in the local area because the
equipments are not located in the
control room they are located in some
areas uh where quite possibly a
dedicated staff has been put to monitor
them. Though in control room it is
surveillance that means all the
information is coming and the various
trips and parameters they are brought to
the control room uh and continuous
monitoring is going on. Now what what to
do for continuous monitoring? If any
parameter is changing its state from
safe state to or alarm state uh there is
a audio visual signal will be there and
it will draw attention of the operator.
Uh what is got deviated? 90% of the time
it is some minor corrective action that
is required to start something, stop
something, close a wall, open a wall. If
it is electronics um something is there
then repair the card replace the card is
the easiest thing which can happen. Uh
if it is a electrical system uh then
some alarm is there. Then you see why
the alarm has come. It is some under
voltage relay has failed or uh something
some problem is there because our uh the
actual power supply has fail fail failed
and now our plant dedicated uh power
supply system uh captive power diesel
generator and all they are starting. So
it is a situation of transient. So this
is called a surveillance and if for
every case the objective is same bring
the uh plant to normal operating state
or normal shutdown state. So this is how
uh in input for
uh surveillance and then as we are
telling test and surveillance test and
surveillance means some systems they are
remaining passive mode. So unless until
uh there is some situation or activation
then only they will come into. So there
the periodic testing so surveillance and
test and the control room these are the
follow.
Now timely detection and assessment of
any deviation. So this is the objective
function of surveillance and um test and
surveillance and monitoring. Monitoring
is simply uh keeping a watch on the
parameter and uh steady state readings
that we are and we have a mental model
what should be the uh reading on
instrument when the plant is operating
when plant is shut down or plant is in
any other state. So those templates
should be matching with our mental
mapping you know
um so time uh time uh this is a time-
tested plant surveillance. If we say
that in uh today's word um my plants
have operated safely the credit goes to
the uh the realtime surveillance and
monitoring actually uh it has got some
limitation also but that that's how the
new techniques are coming but it has
done well actually if you say that this
industry has done well that means this
kind of monitoring uh realtime
surveillance monitoring uh should get
the due credit for this and credit
should be given to the designer and
operator also This involves plant
control room and uh and uh respective
local areas staff you know. So total
staff for a mega system it could be of
the order of 20 25 30 35 not more than
that and they are monitoring the system
from control room also and from the
local area. Um even if I put some uh
instrumentation in the site um it is
easier for a local staff to go and hear
the noise and get a sense of it uh
whether why the temperature is going up
why the vibrations are seen today which
are not there the case. So that first
end information is communicated to the
control room and control room uh they
will talk to the uh respective agency or
people whether it is a working hours or
odd hours. Uh that whole procedure
starts you know for corrective action
program.
Um and here maj major activities are
monitoring and uh plant control loom and
corrective action. Um the plant states
may range from normal operation to
deviation. Deviation could be transient
also. So that means in a in a very
fraction of time plant uh changes one
state from another state or it could be
slow deviation uh you know where we can
we can track the deviation but
transients it is like zero or one plant
it was operating it has come to the
shutdown state and alternate plant
states um uh shutdown involving normal
to partulated events
any complex system when they are built u
they are built around the assumption
that some event will occur. It cannot be
avoided. They are called anticipated
occurrence and there is not much bigger
threat. Uh but if system goes from one
state to another state, there are some
inherent issues. So they are called like
power supply failure. It will happen
once in a year or even once in 10 years.
It is it will happen but it will have
its own frequency. But accident like
situation like a breach in the system
and all they they may
may they may come during the life of the
plant ranging from 40 to uh 60 years or
they may happen once in a lifetime. So
they are called rare events but
monitoring is same for both the things
uh through instrumentations you know uh
and then there is something additional
component
walkdown in the plant
there are certain 5% features which if
you don't visit the plant area or if the
the site staff doesn't tell you you will
pick up that thing and some discussion
will started and okay so that what we
see there what is the deviation from
normal operation noise level uh you can
say or uh you know some uh change
patterns uh in the plant or some new
thing has been some somewhere some uh
spot was found weight that means
somewhere some some leakages leakages
were there and that can be seen only in
walkdown actually otherwise it will uh
you know propagate into a catastrophic
failure. So walk down to the plant uh
you know um instrumentation room and
area there is very important testing and
uh routine safety system for routine
system is very important um because
latent failures will show up sometimes
in a transient way. So it is very
important to look for latent causes
which might be whispering something or
which may not whisper something but it
will appear. uh the staff is trained to
take periodic reading. So it it is led
in failure. It might manifest in terms
of some process parameter reading change
in those readings and we have to
understand that. So u fault diagnostic
techniques real time and surveillance
monitoring this is very important
technique. Now faulty technique
I had shown you some faulty probably
intuitively you will be able to see how
the fault tree knowledge can be uh
converted into diagnostics because what
we see there uh is a top event that
means a recupant or the plant uh if I
say fire injection system uh then fire
injection how it can happen so that is a
cause effect analysis okay and we can
create we can develop
the rules using this fault tree analysis
and uh we can develop an expert system
machine learning algorithm uh for file
diagnosis uh not only for fault
diagnosis but also for what action to be
taken. So it is called precursor or it
is called anti-erent and reaction you
know. So um those kind of things we have
and faultries there are some feature is
not only hardware component fault trees
can can take an input on human factor
also common cause failure also and it's
not that there is no provision for
handling common cause failure. The
plants are built uh considering various
methods of isolation of common cause
failure, treatment of common cause
failure and knowing a priority that this
equipments can be a potential uh can see
a potential common cause failure because
of environmental or ecosystems. Okay,
sometimes distance factor, sometimes a
separation factor, sometimes an
elevation factor. If I have three
redundant system and if I put them in
one locality. So if the flooding uh
situation comes all the three will fail.
So uh engineering and safety science has
evolved to the extent that that one will
be located at other elevation. Okay.
Number one uh that is at higher
elevation. So that level rise will not
affect all the three. Second thing is
temperature humidity affects the
electronics. Then uh there may be some s
symptom or signals which will show the
degradation online uh or during uh if
bit testing built-in test some symptoms
will be available. So uh common cause
failure protections are there but it can
happen in spite of all those safeguard
and provisions. So fault tree analysis
is a very uh uh it it it embeds all the
knowledge and but again it depends on
the level of detail we are going see it
is up to up to an analyst to assume in a
fault tree what is the basic component
basic component that means where fault
tree ends last leave I a diesel
generator can be last node for us but
diesel generators also they have many
supporting system like new mobiles I'll
be coming into those types uh starting
air system, lubile system, fuel system,
control systems and you know breaker
systems. So uh we'll come to those
details also. But fault tree at this
point you should understand that the
detailing of the fault trees may require
additional efforts to reach the uh
subsystem supporting system and in
subsystem reporting system also
individual component we should be able
to go. So faulty will give you an idea.
Yeah, this is the thing but you have to
go further in faulty we take wherever
data is available and then we end there
because data is not available but when
when I talk about the fall diagnosis or
prognosis I have to go down further that
means we have to further go deeper and
that is how it can be called as a truly
deeper learning and deep learning
algorithms are also there with us. So,
so now let us see. I was talking about
the firefighting system. Uh because I
chose this system because everyone knows
fire its consequences and what is a
firefighting system. Okay. So u this
firefighting system comprised of a set
that is pump motor and bearing and b
that is again two trends. Why we have
pro provided two trends? because we want
redundant equipment. If this system
fails then this system should come. But
again uh we have one one uh electrical
power supply panel. So in most of the
practical cases even power supplies are
separate but suppose if they are they
are having from the same bus electrical
bus two different breaker and that bus
itself fails. So just for the simplicity
I have taken this electrical power
supplies both will fail. So then what
will happen? This particular thing has
become part of the common cause failure
that is electrical failure and leading
to both the redundant devices. Otherwise
they are independent actually you know
pump motor bearing maybe one separation
in between and then we have
um one wall. So wall A train. So wall A
wall. So this is pump discharge wall.
Here also pump discharge wall. And what
is happening is they are joining
uh both of them to one header and then
it is a firewater injection starts. So
but then we have given only one wall. So
common injection wall. So um this has to
go through the study of common cause
failure category. Okay. And then this
water is sucked from this tank. So tank
is also common
though a rare event but if the there is
no water in the tank for some reason
whatever so then this water fire water
tank also but in sometimes in the
analysis you have to take some decision
that structures specific system the
failure probabilities are very low. So
when I do a common cost fail though to
in principle it is fitting into the
common cost failure thing but I I can
ignore that you know because no leakage
and this tanks tanks are required only
when the injection occurs otherwise we
see uh level and these levels are
communicated to the control room any
drop in this level 10% and we'll
automatically some I have not shown here
the tank will be brought to the normal
level this is the operation So I can
ignore this but let us see how the fault
tree will evolve.
So this is our fault injection system
and they are located in what I have
shown here deliberately they are located
in a room
and it it has got a small opening
because finally they are like any other
industrial systems. Okay. So
firefighting room is there deliberately
I have shown because the room condition
may affect a common cause phenomena in
electrical power supply. It could be
flooding also. It could be fire al even
though it is firefighting system the
this also has opportunity to see some
fire event. So the then the it will
affect the system adversely. So if we
have understood this diagram uh we go to
the next slide and we see how fault tree
uh looks like. So now we know that there
are two trend uh I have given. So
firefighting system failure top event.
Okay. And independent event I'm sorry it
should have been EI you know. So I
independent failure and C stands for
common cause failure. So we have so in
fault tree how it happens this event
will happen
either this alone or this alone happens.
So they have a path. If this acting this
event is reality then the path goes up.
If cause event happened because of this
down the line phenomena it will here
independent failure is
um um like two trains are there
independent train A and train B you saw
in the previous diagram both the train
failure A and miss both the 10 train
failure can only go to the top in orgate
any one happening input happening here
it it goes to the top it activates this
node it is called uh intermediate node.
Okay. So and then finally from
intermediate node it can it can but here
I have given the redundancy uh in the
system the way in real time we had the
redundancy it has been shown over here.
Now end get mean miss train A and train
B should fail to activate this node and
if this node is activated then we have
over here. So now common cause failures
will be what? Water, no water in the
tank. Okay. So I have considered here no
water in the tank, injection wall
failure, electricity failure and human
factor. Human factor means by mistake a
common wall is left closed. It was not
opened after testing. So it rem and
injection failure occurs.
uh somebody uh a team worked on the uh
electrical breaker and they while
testing you have to isolate the breaker.
They did not remove the isolation. So
human factor electricity even if it is
available okay and if it fails then also
it can lead to injection walls failure.
uh that is in final wall failure can
also lead to u you know due to some
component failure or due to human error
or uh you know so because it is single
wall that should work if I want to
remove this probability then I'll put
two walls in parallel injection wall so
if both the walls open
if one wall open our job will be done
but it depends on this design and
finally we have to do optimization
keeping in view the whole perspective
you here the gates are orgate
uh this is intermediate event uh or gate
uh then end gate okay so I should write
orgate here uh transfer gate that means
you can transfer this input and you
develop it on some other page so
independent ta and t b has been
developed on the next page actually so
what happens independent ta pump a
failure motor failure wall failure and
bearing failure and pump failure means
what It could be pump a failure. It is
le leakage. It is a mechanical seal
failure. Mechanical seal is something
which doesn't allow water leakages from
the pump. Pump shaft is rotating and um
the socket is having a stationary. Now
leakage will occur but mechanical seal
type of components are there which avoid
leakage of
water from there. Like you might have
seen generally when pumps are provided
with uh gaskets and all that some
leakage occur but when for certain
things mechanical seal is so rotating uh
shaft uh will be rubbing across the
stationary shaft and provide the
ceiling.
This sign indicates undeveloped events
because uh motor can have its own
failure but I have not developed it. And
then uh this same faulty is applicable
for B also sort of and we got the
independent DB. So if this pump fails
since it is argate here also argate and
top also faulty it is orate it will pump
a failure itself will activate the thing
but again we have end gate there. So
even if this TA fails completely uh it
will not resto both the things have to
fail both the uh TA TA and TB has to
fail uh TA and TB has to fail uh to uh
give the final output. So TA alone u
although I have written TC it is a TI.
So uh so here TI will be activated only
when TA and TB both the fails. Okay. And
then if that happens then output goes to
the so that means fire system failure.
If one fails then output will not go on
top that condition is end condition. But
here one of the event happens it goes to
the top. So this is how it can be
converted into knowledge. So uh looking
at this how I'll develop the rule. So
I'll develop the first rule fire failure
fire system failure uh independent C
failure
independent CCF failure. Okay. And how
independency failure this part C failure
occur? This will occur as uh rule uh
independent A and independent B gets
activated. So the second rule has come
into picture uh CCFC failure is uh water
or injection or electricity or human
failure. So like that we write
production rules and develop an expert
system. This is simple logic that I'm
inventing when you do at the plant level
thousands of the rules are there and
there is a inference mechanism there is
a data because sometimes this may may
not be qualitative input a signal a
process parameter has to touch certain
value and that is some uh real number
okay um so if that is then failure so
for all the component what we have here
we have put here there is a failure
definition and that definition becomes
very important when we develop the rules
because those rules are activated when
uh anything goes wrong or any deviation
occurs. So we have seen the fault tree
and how we can develop the production
rules for the diagnostics.
Now inventory we have brought whatever
injection failures are there finally
they'll become part of this you know and
then we'll know safe unsafe. So our
criteria or our severity will be
dictated. If it is safe uh be happy
nothing to be done it can remain down
but whatever plant requires uh you have
time but if it is unsafe category you
have to take immediate action. So that
risk or severity things are brought in
uh to uh diagnostics uh through uh
inventory methodology. Okay.
And here you get the probability also
there is a quantification also. So these
rules
can take high priority when we lend them
into this kind of situ injection failure
you know and uh the here also it is
injection failure here also it is and
they are all unsafe.
This is fishbone diagram u you have a
cause and effect you know. So cost could
be some fundamental metrics have been
given. It could be contributed by
measurement. It could be by men.
Actually we should say human because men
and women both are contributing to the
uh this present ecosystems equally.
Environment environment makes the whole
difference uh if they are not specific
and it will be different. So what can be
the things? We'll see through one case
study. And then machine
uh has its own contribution methods. And
then we have to connect the dot over
here. How it becomes a reality? One
machine something went wrong. Uh it was
man was there and it was a environmental
and material related concept that led to
the undesired. But we will in a in a
diagram we'll have all the three
probabilities over there actually. So
let's see now how how practically a
fishbone diagram uh looks like you know
so cause causes sorry u the causes we
have uh here um on this line measurement
calibration induces some problem if is
not correct parameters or measurement uh
creates some problem I'm just giving
some example you know how the dots can
be connected And then when we talk about
the machine lubrication, bearing
electrical electric breaker uh these can
contribute to the um these are the
causes that are there which can happen
men training human error institutional
failure. In fact this can come here or
this can come here also. So um then
environment is now plant policy quality
and humidity. Many times quality quality
related issues uh they can uh become
part of the injection failure. So this
applic diagram we have drawn for
injection failure uh erosion aging
corrosion these are routine things. So
some it can this and then uh methods
testing maintenance surveillance that
can lead to so you can say that it can
travel from this end what are the
problems and finally how it it can
define the injection failure here. Okay.
So it has got all the attribute fishbone
diagram could be complicated also. There
could be one or two more um you can say
header elements can be there depending
on the domain that we are operating. If
it is in defense switchbound diagram
will be different. If it is in nuclear
defense fishbone diagram will be how
radiation can affect my electronic
system performance that also can be seen
actually. Um chemical industry they can
have their own causes and failures and
all. So it depends. So domain specific
aspects have to be this is just generic
generic injection firefighting system is
a very generic example and it is better
to understand from generic example.
Now paralysis
the the 80 8020 rule is uh is the thing
that means uh 80% of domain specific
issues can be traced to 20% causes. If
we can find out or correct 20% causes
80% of the follow-up problems, it is a
very powerful statement. Okay. Uh and
parad analysis has this at the center
actually. Uh it it it also provides
ranking. So if I say 80% or 20%. So I
should be able to rank them actually you
know. So 80% failure and 20. So I should
know what is important is I should know
20% causes to address 20%. So define the
problem uh core parrot of philosophy
80/20 rule uh analysis simulation and
bin of the causes of any identical
component okay and diagnostics for
failure. So this completes here and
that's how per analysis perform. Okay.
So output of the par uh so let's say we
talk we are talking about injection
failure I everywhere I'm taking
injection failure as the so um power
supply was the cause you can see that
power supply was common probably this
analysis if you do we will have separate
power supply for both because there it
is ranking very high seven events are
there of power supply failure and
bearing failure this is second five
failures are there so that means uh and
then they they contri contribute to this
is 100% failure and they once they touch
so easily they touch uh here so this
this has to be reduced and this is very
important information we get and quality
and surveillance their events are less
and um we can improvise we can be we can
be but then here in this case we have to
do a uh level three root cause analysis
but here we can do a simply level one
root cost analysis to and what is level
one, level two, level three that we'll
discuss at present you understand it
requires very high attention and uh uh
the root cause analysis is a resource
consuming option. So uh but we have to
apply here because the number of
failures and they contribute. So let us
say how we are meeting the 80/20 rule.
Uh first two causes total 12 uh 12 out
of total 15 causes. 12 causes this these
two causes uh 7 + 5 it makes 20 12 out
of 15 causes and this that means they
address 80% of failure and need
immediate action. The two quality and
surveillance can be fixed. So this will
happen only when this parto chart will
be happen when when I have data with me
and I plot them I rank them I see how
they are there comparing and
contributing to 80% of the failures
actually you know so this is parto
analysis and uh we
um what we have discussed parto and
other root cause analysis techniques and
now Fourth lecture is on root cause
analysis.
[music]
>> [music]