Video summary
Food Frequency Questionnaires (FFQs) are the most widely used dietary assessment tools in nutritional epidemiology, specifically designed to evaluate an individual's habitual diet over extended periods ranging from months to years. Unlike methods that capture short-term intake such as 24-hour recalls or food records, FFQs focus on long-term average consumption patterns, making them particularly valuable for researching non-communicable diseases like cardiovascular conditions, cancer, and diabetes. These chronic illnesses develop over decades, meaning that an individual's typical diet is far more relevant to disease etiology than what they ate on a single day. By asking respondents how often they consume specific foods or food groups—such as apples—over the past year, researchers can aggregate these responses to estimate long-term nutrient intake and rank individuals based on their dietary habits to identify associations with health outcomes.
The structure of an FFQ generally falls into two categories: qualitative and semi-quantitative. Qualitative FFQs focus exclusively on the frequency of consumption without asking about portion sizes, which makes them simple and quick to complete but limits their ability to estimate total energy or nutrient intake accurately. In contrast, semi-quantitative FFQs address this limitation by collecting data on both frequency and portion size. Respondents typically select how often they eat a food (e.g., never, once a month, daily) and then choose a typical portion size from standard references like small, medium, or large servings, or calibrated cups. This dual approach allows researchers to calculate total energy intake and specific nutrients such as protein, fat, vitamins, and minerals by multiplying the frequency of consumption, portion size, and the nutrient composition of the food.
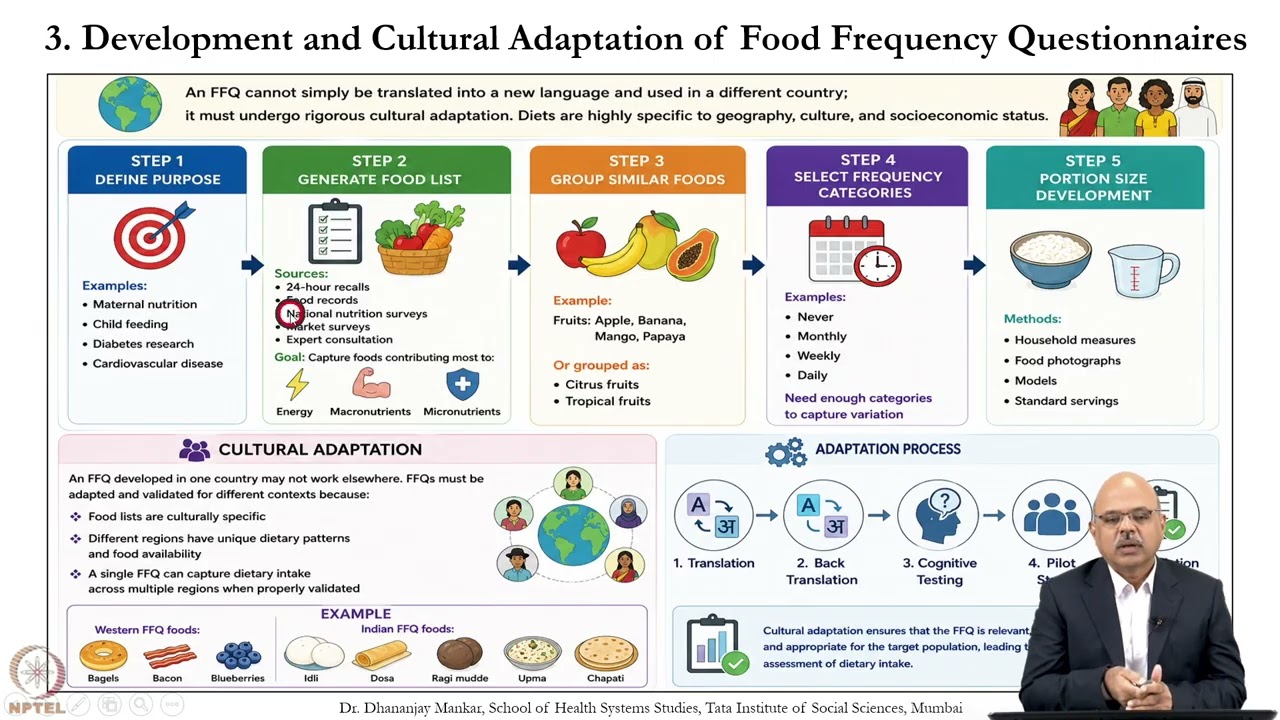
Developing an FFQ requires rigorous cultural adaptation rather than simple translation, as dietary patterns are deeply influenced by geography, culture, economic status, and local traditions. A questionnaire created for one country often fails in another because food lists must reflect region-specific staples; for instance, a Western FFQ might list blueberries while an Indian version would include items like chapati, idli, or ragi. The development process involves defining the study's purpose, generating a comprehensive food list that captures common and seasonal items, grouping similar foods, selecting appropriate frequency categories, and establishing standard portion measures. This adaptation ensures the tool is relevant and understandable to the target population, allowing for accurate assessment of dietary intake across diverse groups, whether in large cohort studies like the Nurses' Health Study or specific regional investigations.
Despite their strengths in assessing long-term intake and being cost-effective with low participant burden, FFQs have notable limitations including reliance on memory, which can lead to recall bias and social desirability errors where individuals underreport unhealthy foods like alcohol or sweets. Additionally, they may miss seasonal foods not listed on the questionnaire or struggle to accurately estimate small portion sizes, potentially weakening observed associations between diet and disease. Nevertheless, when properly validated using statistical methods like Pearson correlation or biomarkers, FFQs remain an essential instrument for investigating diet-disease relationships in population-based research. Their ability to capture habitual eating patterns makes them indispensable for calculating diet pattern scores, such as the DASH or Mediterranean Diet Index, ultimately contributing significantly to our understanding of public health and chronic disease prevention.
Read the full video transcript
Hello and welcome dear learners to the
NPL course on nutritional epidemology a
way towards a healthy life. In the
module three for dietary assessment,
nutritional status and measurement error
for the chapter 27, we'll be taking
discussion on food frequency
questionnaires. It is being even called
as FFQs. So we'll try to understand the
structure of FFQs, the development and
cultural adaptation of food frequency
questionnaires, the components, uses,
validity and reproducibility of the
FFQs, the strength and limitations of
the FFQs will be discussed followed by
case discussion. So what is food
frequency questionnaires or FFQ? has
FFQs are the most commonly used dietary
assessment instruments in epidemological
research. They are being designed to
assess the habitual diet by asking about
the frequency with which food items or
specific food groups are consumed
over a specific period of time. So if
you understand the major objective of
FFQ is to assess the diet over long
period of time
making them more particularly valuable
for research on epidemology and
non-communicable disease. So there is an
association of this with NCDS.
Chronic diseases like cardiovascular
diseases, cancer and diabetes develop
over decades an individual's long-term
average diet
is generally more relevant to the
disease ideology that what they ate
yesterday. So you can understand the
estimate relation of chronic diseases in
research particularly for cardiovascular
diseases, cancer and diabetes. They
develop over a period of time.
In FFQs, they essentially ask
respondents about over the past year,
how often on average did you consume
this specific food?
For example, how often did you consume
apple over the past years? As you all
know, an apple a day keeps doctor away.
This is something which is there as
being taken some sort of an assumption.
So if someone says that one or three
times in a month or one time in a week
or two to four times in a week or five
to six in a week or once daily or even
two or more in a day. So it is like a
habit of consuming something which is
high rich in antioxidants, higher rich
in iron as a fruit as something which is
being seen as more appetizer.
So by aggregating these responses the
researcher can get a calculation about
intake of food and nutrients over the
long term.
The researcher can rank the individuals
based on the nutrients and the food
intake levels where it can be like a
pyramid food that you are making it up.
Also, it identifies the links in
association with diet and the disease
condition which can give you the health
outcomes.
So where it is highlighted to states
that the FFQs has a valuable for
research on epidemology and
non-communicable diseases.
Nutritional epidemology as is an
association between diet and diseases
cardiovascular diseases cancer diabetes
obesity and maternal and child health
outcomes.
public health in association with this
as in monitoring dietary trends of
evaluating interventions and also risk
assessment.
The larger cohort studies you can get
with examples of the nurses health study
which we have stated in the previous
sections also health professional
follow-up study on their health
conditions and a study on European
prospective investigation into cancer
and nutrition.
The positions of FFQs among dietary
assessment method. So there is a
position of FFQS in the 24 hours recall
the food records and you may have a sort
of an dietary history where you can put
the association
if you take the time frame 24-hour
recalls take of previous day 24 hours
food record is of several days FFQ is
for months and years and decade dietary
history is of months
if you take the burden
24-hour recall it is very low because
the time period food record it is very
high and FFQ is extremely low because of
a questionnaire
and dietary history is extremely high as
it takes more time because of buns.
If you consider the cost 24 hours recall
the cost is moderate.
In the food record it is very high
because you take it for months days.
FFQ it is low comparatively because of
the administration the mode of
administration and in diet history it is
very high. What is the habitual intake?
You can understand it is very poor
food record it is moderate FFQ and diet
history is excellent. So you can
understand the assessment of dietary
assessment method FFQ stands among the
position to give you more and moderate
position.
What is the structure of an FFQ?
It has a qualitative
and a semi-quantitative FFQ. So in a
qualitative you can understand there are
a lot of questions actually which gives
us more reason as an individual to react
more subjectively.
The qualitative FQ they focus
exclusively on the frequency of
consumption. It is like how often it is
being taken like how often in times in a
week you have ate apple as an example.
But do not ask about the amount eaten
per person.
How many times is like an
proportion.
The advantages is like simpler, faster
to complete and lower respondent burden.
Limitation is like lacks proportion.
Proportion is something which is missing
over here. So cannot accurately estimate
the total calories and the nutrient
which is to be finded as an constraint
which is being taken in this
in the semiquantitative FFQs they ask
about the frequency and proportion size
which is missed in the first part. So
these ask actually both frequency and
proportion size. Frequency which has
been taken in the first part and added
of the proportion size. So they do this
earlier by providing a standard
reference portion or by asking
respondent to select their typical
portion size. So you can say never or
one or three times per month or one or
two times per week adding with what is
your usual proportion like you may say
small, medium, large, too large. So the
both the things are covered over here.
What is the advantage? It provides data
on both frequency and proportion size
which was missing in the previous case.
It also allows the estimation of total
energy and nutrition intake and this is
a very standard in modern research.
The nutrition calculation is done with
respect to food frequency, portion size
and nutrition composition. So this
allows the estimation of energy,
protein, fat, vitamins and minerals.
You can understand the food frequency.
You can understand the portion size and
the nutrient composition taking the
energy, protein, fat, carbohydrate,
calcium, iron and other micronutrient
intake. The estimation is like energy is
calculation proportion of protein in
terms of grams, fats in terms of grams,
carbohydrates in grams, calcium in
milligram and iron in millig.
So estimation is also there, proportion
is also there, timing is also there and
the intake actually which is taking the
whole lot of formula to be completed for
calculating the nutrition.
Now we will try to understand the
development and cultural adaptation of
food frequency questionnaires.
An FFQ cannot simply be translated into
new languages and
it is used in different countries. So it
must undergo the rigorous cultural
adaptation. It cannot be simply be a
translation which is done with the help
of only changing the words
and languages. No, it is not. The diets
are highly specific to geography. The
diet are very specific to the culture,
soio economic status and even on
festives and cultural needs.
So what is the step? The step is define
the purpose. For example, maternal
nutrition, child feeding, diabetes
research, cancer research, AIDS
research, cardiovascular disease. So on
the purpose, the step one is being
completed.
Generate a food list. Out of all the
total whether it is a 24-hour recall,
food records, national nutrition survey,
market survey, expert consultation,
the goal should be food contributing
most for energy, macronutrients and
micronutrients.
So there should be a purpose actually to
generate a food list which is very
important and this solves the major
reasons to conduct it. Then comes the
group similar foods. There are many
foods which are similar in patterns
taking fruits like apple, banana, mango
or papaya. They can be grouped in
tropical fruits, citrus fruits, sweet
fruits and all those.
Then comes the step four that is select
the frequency categories.
Example you may say never taken monthly
taken weekly I can take daily I can say
or twice a day twice a week. So need
enough categories to capture the
variation to make it more frequency
based
then comes the very important part that
is proportion. proportion in terms of
size whether it is a household measures
that you are using or you're using some
calibrated cups and all those or food
photographs or models or standard
servings.
There are two things which comes not as
unconstraint but as considerations to be
taken as that is cultural adaptation and
adaptation process.
So in cultural adaptation an FFQ
developed in one country may not work
elsewhere. FFQ must be adapted and
validated from country to country
because food list are culturally
specific. In different countries they
are very different.
Different regions have a very unique
dietary patterns and food availability
even within a country. I mean to say
even in country like India in regions
and in states you may have a very
different dietary pattern according to
the availability also it changes the
diet.
A single FFQ cannot capture
a dietary intake or sometimes if you
even try to make it as a single FFQ
which can capture a dietary intake
across multiple regions when properly
validated. So there are two variations
which may comes that sometimes
validation can make it more adjustable
versus if the validation is not done it
cannot really capture. Western foods are
more like a examples like beon or
blueberries or bangales or Indian foods
are more specific with the chapati,
upma, raggi, dsha or idli
where the cultural adaptation ensures
that the FFQ is relevant, understandable
and appropriate for the target
population that you are trying to
assess. It also leads to the accurate
assessment of the dietary intake which
is the purpose of the food frequency
questionnaire.
Now we will try to understand what are
the components of food frequency
questionnaire. In components there are
three divisions that are being made that
is food list. Second is the proportion
size questions and the frequency
categories.
The food list is something which is very
important here to be understood where
usually it contains more than 80 to 100
food items or nearly you can say it
takes more than uh closer to 200 food
items. The food list should capture
common foods, seasonal foods,
nutrient-dense food or even fish items
and all those according to the
categories and the region specific food
availability or staple diets.
The examples can be cereals, pulses,
millets, vegetables, fruits, milk
products, fish, eggs, meat, pork,
snacks, beverages
and so on.
In terms of proportion size food for the
FFQ, you can estimate the amount usually
in terms of the consumption.
You can say for the methods a standard
proportion is one serving assumed for
everyone which usually many times the
Indian family follows where the FFQ the
proportion is being given in the
questionnaire
multiple portion categories you may say
small medium large to large and all that
can state that there's a multiple
portion categories which is being used
open-ended portions where you can say
number of cups or spoons or grams
which is somewhere or the other you move
on to the complexity where you have to
derive according to the proportion in
terms of measurement you have to state
this.
The third and very important part is the
frequency categories. These frequencies
are converted into daily intake
estimates. Category wise stating that
never is equal to zero or 1 to 3 months
you can say 07 per day 1 week4 per day 2
to 4 weeks 43 per day or daily that is
one per day or within 2 days you can say
two per day. So what what does it mean
by there should be some sort of
categorization and the frequency can be
made according to that. So these
frequencies are converted into daily
intake estimation. Frequency multiplied
by portion size multiplied by nutrient
composition. What does it gives? It
gives equal to daily intake estimate.
The daily intake estimate is the purpose
of understanding the food frequency
questionnaire.
Now the use of food frequency question
where it is being used. It is used for
diet pattern score. A diet pattern score
which is very important where the foods
are consumed together. Interaction
occurs between the nutrient foods and
cooking methods. There are three
trajectories the food has to go through.
One is the nutrient what it is being
there. What is the sort of food that is
to be prepared where you can say the
meal or what are the cooking methods
which makes one meal different from the
other meal
might be a rice which is being prepared
in the morning might be very different
for the rice which is being prepared in
the evening or at night.
What does it makes the traditionality
for the nutritionbased food approaches
focusing on individuals nutrition needs
in modern epidemology? It is increasing
the studying these dietary pattern which
makes a variation to understand the
health outcomes.
There is a dash score over here. There
is a meditian diet score and a
plant-based diet index. So we'll try to
understand in detail what those are. So
you can say the dashboard score is an
assessment aligned with the dietary
approaches to stop the hypertension
rewarding high intakes of fruits,
vegetables and low-fat diets and
penalizing high sodium and saturated
fats. You can understand there is a very
noble purpose of taking this.
So you have a higher score for fruits,
you can have a higher score for veggies,
whole grains and low fat dairy. You can
say there's a boost. Higher dash scores
indicates better alignment with heart
healthy dietary guidelines and you may
have your heart more good in functions.
The lowest scores for sodium, red meat,
sugary beverage and alcohol.
So the dash scores are more
giving proportion towards higher scores
and lower scores for food which are
indicating according to the health
dietary guidelines.
Now we'll try to understand a meditarian
diet score. In Meditarian diet score it
assigns points for above median
consumption of the protective food.
Protective food like which are lowering
the inflammation olive oil, legumes,
fish, cesum oil and also below median
consumption of detrimental foods.
Detrimental foods which are more
something which can say increase the
inflammation, lowers the immunity or
increase the risk of cardiovascular
disease condition.
Red meat and sweets particularly. So you
can say higher intake is necessary from
olive oil to fruits, veggies, legumes
and fish. Moderate intake of dietary or
higher fatty dairy.
Lower intake of red meat. So higher
Mediterranean diet score are associated
with lower risk of chronic diseases.
Then comes the plant-based diet mix that
is PDI.
The differentiations between a healthful
plant-based diet that is whole grains,
nuts and unhealthy full
plant-based diet that is refined grains,
sugary beverages. So you can say the
measure ad to healthy plant food, whole
grains, fruits, veggies and legumes and
lower score goes on animal foods,
refined plant foods and sugar beverages.
So a higher PDS score reflects a
healthier plant-based dietary patterns.
So why FFQs are ideal for pattern
analysis? The reason is long-term
intake. It captures diet over months to
years reflecting a very habitual
behavior which is a benefit of taking
this. Then comes the usual habit. It
reduces the day-to-day variation and
random errors. The food combination
gives more inclusions of a wide variety
of foods and meal eaten together
and no doubt making them highly suitable
for dietary pattern research. So dietary
pattern research is somewhere or the
other the ideal way to be dealt by FFQs.
The validity and reproducibility of
FFQs. A dietary instrument must be valid
and reliable. These are the two
important things which is very important
to be stated to be of remembrance if you
are trying to take FFQs which makes
dietary instrument a very standard way
of dealing with the challenges that
overcomes to these FFQs
if they are validated and reliable. No
doubt you may get a very standard health
outcome. The validity is based on the
ability that the FFQ measure what it is
intended to do. It does the FFQ actually
measure what the person eats. So
actualness is very important rather than
assumption.
The common validation statistics like
Pearson correlation which is very
important to be taken as an
validification method,
Pearson correlation, deatuated
correlation, bland analysis and
crossclassification.
The typical correlation comes like
energy, protein, fat, fruits and
vegetable in terms of the correlations
which are being stated on the right
side.
Reproducibility, the ability to obtain
similar results when the FFQ is
reported. Example, administering the FFQ
today and again after 1 month. So
there's a sort of an comparison actually
which is being stated in terms of the
similarity of the results statistical
measures intraclass correlation
coefficient IC
Pearson correlation and kapa statistics
because of the repetition you have to do
this level examples of validated FFQs
you may see the examples being stated
the first is NCI diet history
questionnaire that is DHQ.
It is being taken in US National Cancer
Institute. The characteristics are
developed by the US National Cancer
Institute and it is one of the most
rigorously validated FFQs. It consists
of 80 to 120 food for a total diet
assessment which is very large. The
purpose of the DHQ is to obtain
frequency and portion size information
over specified period that is past
months or years.
The second examples of validated FFQ
comes as Harvard will vlet FFQs. It is
taken by Harvard Thchan School of Public
Health. The characteristics are it is
widely used in the famous nurses health
study and it has been popularized with
this study.
Then comes block FFQs developed by
Glatty block.
It is heavily focused on accurately
capturing the nutrient intakes based on
NHES data.
Then comes a study which is being stated
that it captures from India that is
semi-quantitative FFQs. The
characteristics are showed acceptable
validity across multiple regions. As you
can understand the constraints which
comes into different Indian regions
actually to give it for the FFQs. Other
India specific FFQs can be region
specific, population specific. It can
also include the local foods, mixed
dishes, seasonal and traditional items
extensively validated using recalls and
biomarkers.
What are the strength of FAQs? Long-term
intake assessment which is already
stated. It has a seasonal variation,
habitual diet, usual eating patterns are
also being taken. Cost effective
estimated to hundreds to thousands and
even over a mail and online. So there is
a massive prospective cohort studies
also which are making it economically
feasible.
Low participant burden where it is a
reduction of time from 30 to 45 minutes
where a quick completion time versus
weighing and recording food is being
something as a constraint which comes to
the respondents.
Excellent for ranking you can say it
comes more than the moderate intake to
higher intake on options to take for a
small, medium and large in terms of
proportion. You can say what are the
higher quantiles versus to the bottom
quantiles accurately. It classifies as
the individual in groups. So it is
stated to be very useful for calculating
the disease risk ratio
also self-administered which gives us a
benefit of getting to a literate
population and it also minimizes the
data collection expenses which is very
important constraints where we talk
about the economy.
Taking the limitations social
desiraability we are always over
repeating is more for healthy food as
you can understand and see the picture
unhealthy foods usually under
reportporting when you are taking
alcohol or beverages sweeteners you
really don't report recall bias usually
it is a strain on the memory to give the
participants may not remember accurately
for the food sometimes they have missed
in terms of a small proportion or small
collect proportion size is something
which is difficult to estimate food
which is fixed in the list are only the
one and the missing which are not there
are something which seasonal for example
strawberries or even we can say dragon
fruit which are not listed over there
are being missed
nutrient estimation like proportion
assumption food consumption tables and
estimated nutrition there might be
generic databases or generic data size
there can be some sort of an errors or
sometimes it may be missed In terms of
the calculation measurement error
consequence what it is it is something
as a diet disease association where the
weaker apparent association is being
stated where observed weak relationship
is being underestimated.
So the attunated versus weaker apparent
association is something which estimates
or give a true relationship.
Now there is a case distinction uh case
discussion which I want to take ahead.
So this is the India specific food
frequency questionnaire. So India
presents unique challenges for dietary
assessment because of its enormous
diversity in terms of geography,
culture, religion, a soioeconomic
patterns, food availability and cooking
practices. So you can say a single
universal FFQ really captures dietary
intake accurately across all Indian
population. Most Indian FFQs are region
specific. They are population specific
or they undergo extensive validation.
Might be it's a time-consuming job. They
have to take step one as dietary survey
where the researcher conduct it in a
multiple 24-hour recall taking in
consideration all the variations. Step
two selection of the food items which
are there on the macronutrient size for
the micronutrients.
Understanding the energy, protein, fat,
carboids in the macro.
Grouping the categories where you can
say the major categories are four
cereals, pulses, vegetables and fruits.
Step four towards the proportion size
where you can say in terms where Indians
usually come up with rice taking in form
of a proportion for bowl or kori or dal
in terms of kori or milk in terms of
glass or chapati in numbers.
So number versus the usual measurement
part. The typical structure of an Indian
FFQ is a comprehensive Indian FFQs may
contain 100 or more than that or closer
to 50 food items which can be grouped
from cereals, meallets, pulses, legumes,
veggies, fruits, dairy products, fish,
eggs, meat, oils, snacks, sweets and
beverages.
The important FFQs which are being taken
in India are the National Institute
Nutrition FQS which is developed by ICMR
and National Institute of Nutrition. The
characteristics were adapted to Indian
foods used in nutrition studies and it
includes regional dietary variations.
The application was in nutrition
surveillance and public health research.
Very important. The CARES FFQ which is
developed by center for cardio metabolic
risk reduction in South Asia which is
very uh approximately covering 160 to
200 food items capture intakes of across
India, Pakistan and neighboring
countries validated against a very
repeated recalls and used for diabetes,
obesity and cardiovascular disease. The
EP new India FFQ that is developed by
nutritional epidemological studies and
it is very region specific designed to
estimate and long-term in intake
including mixed dishes common in India
which is very very difficult actually
the Kerala specific FFQ is specially
designed to understand the coconut based
food preparations
the fish consumptions and traditional
foods very interesting to understand
this which is useful for cardio
iovascular disease studies which are
very common in Kerala and metabolic
syndrome research which is very
important to take ahead the responses of
understanding the hormones.
Urban Indian FFQ is designed for
metropolitan food and nutrition
transition studies which are
understanding the burden of food over
here which includes food which is fast
food, processed food, sugar and
sweetened beverages in additional to the
traditional additional foods. The
special challenges in FFQs in India are
particularly mixed dish and it gives a
variations seasonal foods which are more
uh clubbed with lot of consumptions and
festive foods which gives lot of
variations in terms of the annual intake
and contribution. Regional diversity is
something which is a complexity and
sometimes it has been seen in many
places from southern states to even
northern states. Therefore many FFQs in
India the core nutritional food list and
the region specific leads are modulated.
So with this we come an end to this
chapter. In the summary I can state that
FFQs are widely used a dietary
assessment tool which are designed to
measure an individual's usual food and
nutrient intake over a extended period
typically months and years. They collect
information on how food often the
specific food are consumed in specific
semicontitive versions and the usual
portion size. FFQs are particularly
valuable in nutritional epidemology
because they capture a habitual dietary
pattern relevant to chronic disase
development. They are very cost
effective, easier to administer in the
larger population using for ranking
individuals according to the dietary
intake. However, the FFQs rely on memory
and self-reporting. There comes sort of
an individual bias making them
susceptible to recall errors and
systematic biases which we have studied
in the previous sections. Despite this
limitations, FFQ remains one of the most
common used method for investigating the
diet disease relationship which is the
purpose of nutritional epidemology in
the population based research. So with
this we come and end this chapter. These
are few important references which you
can take and help for.
Thank you. Thank you very much.
[music]
[bell]
[music]
>> [music]