Visualisation of Moodle Logs with Help of Custom R Shiny App (MoodleMoot Estonia 2026)
Watch on YouTubeVideo summary
The speaker, a veterinarian with no prior experience in software development or online course creation, shares her journey of analyzing data from an educational project she helped design for high school students. Although the team successfully created a fully online veterinary medicine course using H5P tools over seven weeks without collecting extensive personal data beyond names and emails, they faced significant challenges after its completion. With 160 participants having finished the program, including final quizzes and optional institute visits, the speaker needed to evaluate whether the course was effective but lacked technical expertise in log analysis or procrastination management strategies typically used by developers.
To address these evaluation needs, she initially attempted standard Moodle reporting features which provided raw logs containing over 400,000 lines of data that were difficult for her non-technical background to interpret meaningfully. Recognizing the limitations of built-in tools and realizing she needed deeper insights into participant engagement patterns rather than just basic completion statistics, she decided to build a custom solution despite having never developed an application before. She turned to artificial intelligence assistance using white coding techniques where prompts were crafted to generate R code that could automatically process the massive log files without requiring manual file uploads or complex configuration steps.
The resulting Shiny app successfully transformed raw data into actionable visualizations including participant counts, click tracking graphs, engagement metrics, attrition rates, and funnel analyses that revealed patterns invisible in standard reports. The application allowed for interactive exploration of specific elements such as deadline adherence, anonymized user identities, final test performance summaries with correlation tables displayed on logarithmic scales, density plots showing time usage distributions across students, and weekly accumulation charts tracking clicks per H5P task over the course duration which could be generated within just a few days.
The speaker concludes that when facing analytical problems where traditional methods fall short or expert help is unavailable, creating custom applications with tools like R Shiny can provide powerful solutions even for those without extensive programming backgrounds. Her experience demonstrates how leveraging AI assistance and white coding workflows enables individuals to bypass technical barriers and extract meaningful insights from complex datasets while acknowledging that the entire project would not have been possible without contributions from many students who led the course development efforts under her supervision.
Read the full video transcript
So, welcome everybody. U as I said, my
name is Tminina and I'm the very last
obstacle between you and your cold
beverage today tonight. And uh uh just
to give you a background, uh
I started using uh mood since 2015. So
definitely uh I am not an expert or an
uh even a developer and my background is
actually in veterinary medicine. So
please keep me keep that in mind. I'm a
vet not a developer.
Now now you might ask like so why am I
here right? Actually so uh there was a
thing which we created. So we had this
uh online course uh and um
uh I played a key role there and it was
a fully online course. But the problem
was that I have never developed a fully
online course
and this course was just to give you
like a hint like what what what is it
what is it to study veterary medicine
and uh the target the audience was high
school students but we didn't collect
like any personal data only okay yeah
name and email uh but uh where you came
from or what you did we didn't care just
register
and have fun.
And uh we had 160 participants
and the core structure just to give you
a background here. So it was like semi
self-paced. So again like you did what
you'd liked but it was designed to be
approximately two hours of work per week
and we used
uh H5P.
Uh so and it was de so there was seven
activities
and each activity
had a different topic. So like one topic
per week. So seven weeks
and there was a forum where the veterary
students answered the questions for the
participants and there was a one last
final quiz uh which you had to solve in
order to prove the completion of the
course.
And in the end there was a cherry on the
cake. Uh you uh if you completed the
course you were invited to visit the
institute and have a tool
not the problem right like I said that
never designed an online course. So
uh the first question would be like did
did it actually work right and the
second course how to check it like again
I had no experience
and the logical answer is of course logs
right
so I don't know how what you do for
procrastination if you have like a 100
million things to do and uh the
deadlines are on your neck like a ton of
bricks.
You click through the model and you
check what the developers have done and
uh and uh today my suspicions were
confirmed that the model was developed
by many many people and uh and the we're
going to go see it.
So if you look in the course,
click there
reports and voila, there are the logs.
Never used them. And I especially like
this button here. Get these logs. Right?
Whoever came up with this is uh was
genius, right? And I want these logs. I
really want these logs.
Not only
do I want these logs, I want more. I
want get something out of these logs,
but there was a problem.
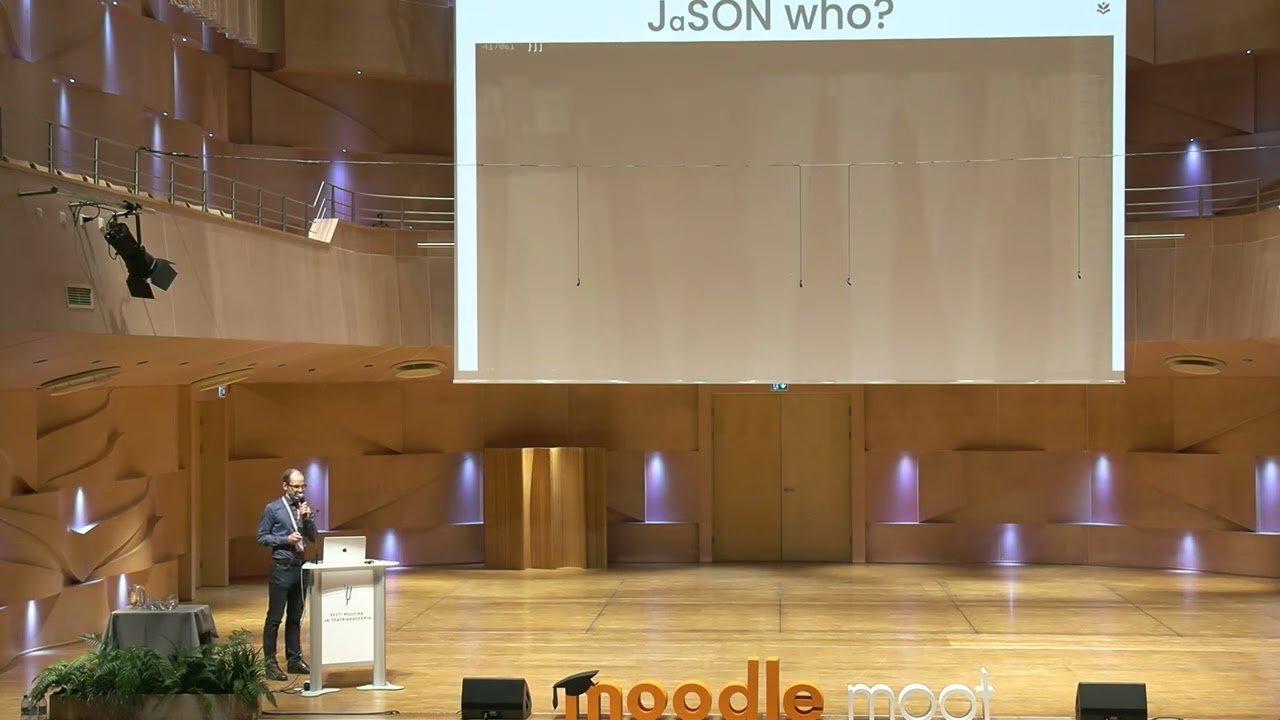
There's a there was a person on my way
called Jason,
right? And remember, I'm a vet. I don't
know who Jason is. So, I just downloaded
the
What could go wrong, right?
There is
400,000 lines. Okay, that's a quite a
lot for me.
And the question is like okay 400,000
lines
what does what does the model even log?
What what what should I do? Right? And
uh the next logical step would be of
course would be that okay why not use
the model built-in dogs tools.
Well the actually again like I said I
wanted more. So again the tools which
are at the moment built into the model
are not what I actually actually wanted.
So actually
the next logical step is build your own
app right
and the problem is again like I have
never built an app
right so how difficult could it be
well there's this famous saying right we
do this not because it's easy but we
thought it could be easy
All right. And now,
so the next step was Google
anti-gravity, right? Anybody used
anti-gravity.
Okay. So, and white coding.
Let's go.
Right. So, I tried to find the full
prompt which I used for the first time.
I didn't find it. So, but it most likely
it was something like this. So help me
create a shiny app,
right? Make it nice,
right? Very uh if you have learned
prompt engineering, you have to be
specific, right?
Right. So I was again like I was a
little bit unsure about the JSON. So
again like just visualize J for me just
do it.
uh and very important you have to give
background right so it's I said okay AI
it's a online course
and
uh because I don't know how to analyze
online course so give me suggestions and
look at the lo and let's look at the
logs
as simple as that right well
not it wasn't so straightforward
uh but let's look at the anti-gravity So
I'm going to this might look a little
bit like intimidating in the beginning.
No worries. I'm going to walk you
through. So most important part here
agent,
right? And then here is the code,
right? Don't don't look at the code, see
through the code.
And here we check with the agent,
right?
So for this like okay here's an example
uh that was not too convenient. So I
said okay make it more convenient. I
don't want to upload files there just
take the files and make it happen. So
I'm going to
send uh you send the prompt to agent
then says oh there's an R code here
generates. Okay. Now the agent is not
very polite. Always says okay seems like
you gave me the wrong file. No matter I
will manage
and it checks the files which are
actually there.
So here is the end result. And now again
the very important part about white
coding is that when you start white
coding is that the green parts are the
words which come come into the code and
the red parts are the ones which go out
of the code. Right?
And the most important part about wipe
coding is here. You're going to see you
can see the arrow. Wait for it.
accept all.
All right, my work is done here.
Now, uh the second best thing to go is
the R studio. So, let's go to our studio
now. And uh there's a very important
button there,
run app,
right? You have to click it.
And voila, we have the app. So we can
see the particip number of participants,
the clicks, all kinds of graphs here,
engagement,
attrition, funnel. I would have never
come up with this,
but that's there's more. So like we can
click things. So deadlines,
anonymous names, we can anonymize.
uh we can look at the for example the
final test. So here is the summary of
the final test stuff.
How much time did they spend like and
here is a correlation table and of
course we want to see it in log scale
right because log scale it would be very
important. We want to click and see
things.
Uh there's also like correlation between
the clicks and the score.
And my special favorite density plot,
right? How much time uh did the student
uh student student participants uh use?
But that's not all, right? We want more.
We want to see we want to visualize,
right? So this is like uh the uh the
week by week. So it was 7 weeks plus the
introduction videos and this is on a
time scale and how the clicks uh
accumulated
uh per task per H5P task.
Again really nice to see and only takes
a couple of days.
So
does it move?
So, what is the take-h home message?
If you have a problem
and no one else can help
and if you can find it,
maybe you can solve it with a custom
shiny app.
Okay. And the last one. So again uh
would find this work would have not been
possible without the tremendous help of
many many people who contributed to this
course and I'm just here's our team and
it was mostly le led by students I just
uh provided some help there
thank you
thank you Dharma for presentation
Do we have a question?
Oh, okay.
Okay, more questions.
Okay. Oh, I see. Yeah, thanks. Very uh
very interesting and nice talk. Uh I was
just curious why did you choose to do it
with R and Shiny?
>> What's the most logical answer?
Why? Well,
I didn't know I didn't know any better.
I have heard about shiny, so whatever.
Let's try it. How hard can it be?
Fair