Stop firefighting: practical observability for Python APIs, workers & jobs - Daria Korsakova
Watch on YouTubeVideo summary
Daria Korsakova shares her practical journey of building observability from scratch for a Python-based analytics service at ManyChat, emphasizing that effective monitoring is essential to avoid constant "firefighting." She explains that a system is truly observable only if it can quickly answer critical questions such as whether it is up, ready to serve traffic, doing useful work, and what has changed recently. Her team learned this lesson the hard way after inheriting a production system with minimal monitoring; when issues arose, they lacked the necessary context to debug problems efficiently, often leaving them guessing at night while customers waited. The core argument of her talk is that observability transforms unpredictable panic into predictable debugging by providing clear signals about system health and recent changes.
The presentation highlights that different types of workloads—APIs, workers, and scheduled jobs—require distinct monitoring strategies because their failure modes differ significantly. For APIs, the focus should be on readiness checks, error rates, latency tails like P95 and P99, and specific dependency metrics such as cache hit ratios to distinguish between application slowness and database bottlenecks. Workers are described as sneaky because they can appear healthy while doing no useful work, so tracking the last successful progress timestamp is vital to detect when a worker has stopped processing messages. Scheduled jobs fail quietly and may run for hours without producing results, making it crucial to verify whether they executed successfully and generated output within an expected timeframe rather than just checking if the process is running.
To effectively diagnose issues, Daria advocates for combining application metrics with dependency metrics to trace symptoms back to their root causes, such as a maxed-out database connection pool. She outlines the three pillars of observability—metrics, logs, and traces—and recommends starting with structured logs that include correlation IDs to follow requests across services, followed by minimal viable tracing at critical boundaries like database queries or external calls. Alerts should be designed to fire only when immediate action is required, providing context such as dashboard links and runbooks to guide engineers, thereby avoiding alert fatigue where teams become overwhelmed by notifications for every minor fluctuation.
Finally, Daria proposes a five-phase rollout strategy to implement observability without overwhelming a team or delaying product launches. This approach begins with basic health checks and error logging to ensure failures are visible, progresses to adding workload-specific metrics, then introduces high-confidence alerts, followed by comprehensive dashboards and runbooks, and concludes with the addition of traces once the foundation is solid. She encourages developers to adopt this checklist from day one rather than promoting a poorly monitored prototype into production, noting that while things will always break, having the right tools allows teams to know exactly where, why, and what to do when they do. Ultimately, the goal is to protect both current users and future maintainers by ensuring that system behavior is transparent even under pressure.
Read the full video transcript
Um, yeah, I'm scared as hell to be
honest. You know, it's my first time.
So, yeah, let's start. Uh, hey everyone.
I'm Daria. I'm uh I'm from Amsterdam. I
live in the Netherlands for um almost
six years already. I like uh canals. I
like windmills. I like uh even the
weather Dutch weather I also like quite
a lot even though during winter it's
more like you know survival mode. Uh so
a little bit about myself I work in tech
for more than 16 years already. Uh I
started as QA engineer then I decided to
switch to back end engineering because
yeah five years ago because at some
point I got tired of breaking stuff. Uh
I wanted finally to build something
myself and currently I'm a little bit
obsessed with observability just a
little but yeah uh now I'm working at
many chat we help creators and brands to
automate their conversations.
Uh so most likely you know these
mechanics you open your Instagram uh you
follow some creator you and creator ask
you uh just send me vibes in the
comments and I will send you good vibes
uh in direct message. So this is in a
very nutshell about many chat uh and my
team me and my teammate Arthur say hi.
So it's just a a team of two of us, but
we own the data processing and analytics
part of uh Manyhat. And uh less than a
year ago, we uh shipped the brand new
production service written on Python uh
for analytics,
which means in turn that um back then we
had no observability safety net at all.
So we needed to build everything from
scratch for API, worker and job.
Uh so uh everything I'm about uh to tell
you we didn't uh get from any textbook.
We kind of went through this. We I would
even say that we lived through this. So
uh let's uh set some expectations. Now
uh I'm not going to tell you about any
internals of some observability tools.
uh my talk is more like uh practical
vendor agnostic uh checklist of signals
that really really matter and uh so if
you haven't built any observability yet
or you just started so take my checklist
uh as a shortcut past everything we
needed to learn the hard way and um
what else I wanted to say sorry guys
uh and if you already have observability
then I bet you will find one angle or
maybe two that you can steal and adapt
to your stack.
Okay. So um ah yeah what else I wanted
to say that uh this talk is real like
essence of two parts of my article that
I wrote about observability. I will
share the QR codes at the end. Uh so we
will move fast and stay practical as
much as possible. So just bear with me
and uh yeah here's our plan for today.
We need to answer a few questions and
the first one is what does it actually
mean for a system to be observable uh
because if we don't understand it how we
can aim for it right uh the second
question is uh does this answer look the
same for every type of service API
worker and job
uh so it's going to be quite huge part
about metrics they will tell us
something is wrong but how do we find
out what happened and where we also need
to answer this question
uh Then um going to be part about alerts
because something should tell you what's
wrong and the last uh part how do we
actually start without um doing
everything all at once. So I will
provide you uh the rollout strategy so
you will not get overwhelmed I hope. So
how does it usually starts? It starts
innocently. You have hypothesis P MVP
whatever you call it. So you need to
check something really really quickly.
Uh you don't build something huge just
to check an idea. Uh so uh you build
something quick and dirty with just
enough monitoring to answer two
questions. And for us it was does it
work and is it fast enough and we also
had just minimal monitoring couple of
logs couple of charts that was enough
for us. And what happens next?
Hypothesis works. Uh it's got shipped
but then one thing nobody ever decides
on a meeting. That same quick and dirty
setup got promoted to production and now
is guarding real traffic with real
users. So nobody signed off on it. Uh it
just happened.
Um
so this is the system me and Arthur we
inherited less than a year ago. So it
was service on production already
working and one day when it didn't work
we realiz realized something really
really uncomfortable for us. We didn't
know where to look. Uh we just had uh
two latency charts and that was
basically it. So you know uh production
has a special talent to turn everything
seems fine into everything is on fire.
And we learned it the hard way possible
three times. And I will get back to
those stories. Uh this is basically the
reason why this whole talk exists.
Uh but before we fix anything, we need
to answer our first question. What does
it actually mean for a system to be
observable? And I would say that we use
quite practical and easy definition.
System is observable if you can answer
those questions. Is it up? Is it ready?
Is it doing useful work? What changed
recently? Really, really fast.
Uh so let's take our setup. Uh I already
said that we had the most amazing ones
uh latency dashboards ever. So we uh the
night when our database fell over we
could answer the question is it slow?
Yes. But the hardest questions for us
were um what changed recently and is it
fast? Uh not not is it fast enough what
changed recently and which dependency is
involved. Uh so the only thing left for
us was guessing. Well, of course I
started to panic first. This is just who
I am. Uh and uh so you know this is uh
so if you can answer those questions
really fast then debugging gets
predictable maybe even boring at some
point but this is good. Uh if you cannot
then you panic uh maybe even during at
night while your customer is waiting. So
this is for sure a not nice thing to
encounter.
Uh this is basically the firefighting
this talk is named after.
Um so yeah answer
these questions fast then your system is
observable enough. But uh do this answer
look the same for every type of
workload? And here is the trap because
they don't. So um is it ready to serve
traffic or not? This is life or death
for an API. But this is completely
useless for schedule job. Is it uh doing
useful work? This is where uh your
worker can quietly betray you really. So
uh yeah, let's uh meet our three heroes
[snorts] and we will start with API. I
would say that API uh this is the
loudest workload because if something is
broken your users will feel it
immediately right away. Error rates
latency will show it really really
quickly. Uh and uh questions that really
matter here are is it ready, is it fast
enough and is traffic normal? But did
you notice that I skipped uh is it up?
Because this one might fool you. And
this is how it fooled us. So one day
night I don't remember exactly. So one
day our uh one of our pot crashed uh
then got recovered. This is normally
normal behavior for pots. They do this
but when it got recovered it received a
new IP address and this IP address was
not in our dependency um white list. So
our application tried to uh start up but
got refused and it just never came up.
But what about our system? Our bot was
running, everything was green, everybody
was happy but the app just never came
up.
[sighs]
So I would say here that is it up and is
it ready to serve traffic? This is two
completely different questions. So you
do need readiness signal.
Uh and now let's go back to our everyday
questions. Uh and I already showed them
to you. Is it failing? Is it fast
enough? But here I would like to point
out one thing. So median requests are
too polite. Your users usually feel the
slowest one. So please watch the tails.
P95, P99 and then you are good to go.
But also on top of this add one or two
signals specific to your service because
um yeah you need uh to to see
just a few signals that will explain
behavior of your service. Uh for us for
example it was well still is cash heat
ratio our API heavily leans on the
cache. So every time when we see that
latency our latency moves uh we need to
know is it uh cache uh do we start
missing cache or and started hammering
database behind it. Okay, let's move
forwards and now workers. Workers are
really sneaky guys because they could
again here uh the question is not is it
up but is it doing useful work because
um so worker can look really really
healthy but completely dead inside I
mean completely dead workload. So um it
at some point it might quietly stop
consuming uh for example it can
successfully read event but then cannot
handle it or process it. Uh or for
example one poisoned message might be
stuck in front of the queue.
Uh [sighs] so there could be many
reasons. Fortunately this one never blew
up on us like us. Yeah. [laughter]
And uh but what if it had uh then well
in our service our users would get stale
data and they will start to ask us like
hey guys why am I still seeing this.
Um
so uh here uh again question is not is
it up but is it doing useful work and
handful of signals can answer this
question. But also here I would like to
point out one uh signal that I will
never run worker without and this is
last successful progress time stamp
because again it might be alive for two
hours but doing completely nothing for
two hours and that one god is screaming.
Um our third hero schedule job and um
schedule jobs I would say that they fail
quietest of all three because you know
scheduled job could uh do nothing for 23
hours and it's perfectly fine. Um so
questions so I would say that uh normal
service monitoring is not that suitable
here and questions here are did it run
was it successful and did it produce uh
something useful and recently enough and
this one actually happened to us. Uh so
one night well we have schedule job that
runs every night. Uh it refills our
database from our data warehouse. So one
night it ran it reported success but it
processed zero rows
and um yeah what about our system? Uh
again everything was green but in
reality um so it turned out that in
reality uh our upstream data pipeline
was misconfigured and um so it was not
our bug but it was our problem to notice
for sure. Uh back then we well at that
moment we didn't have any alerts yet. It
was still in our to-do list but uh so
you know production has impeccable
timing. Uh but how did we find out about
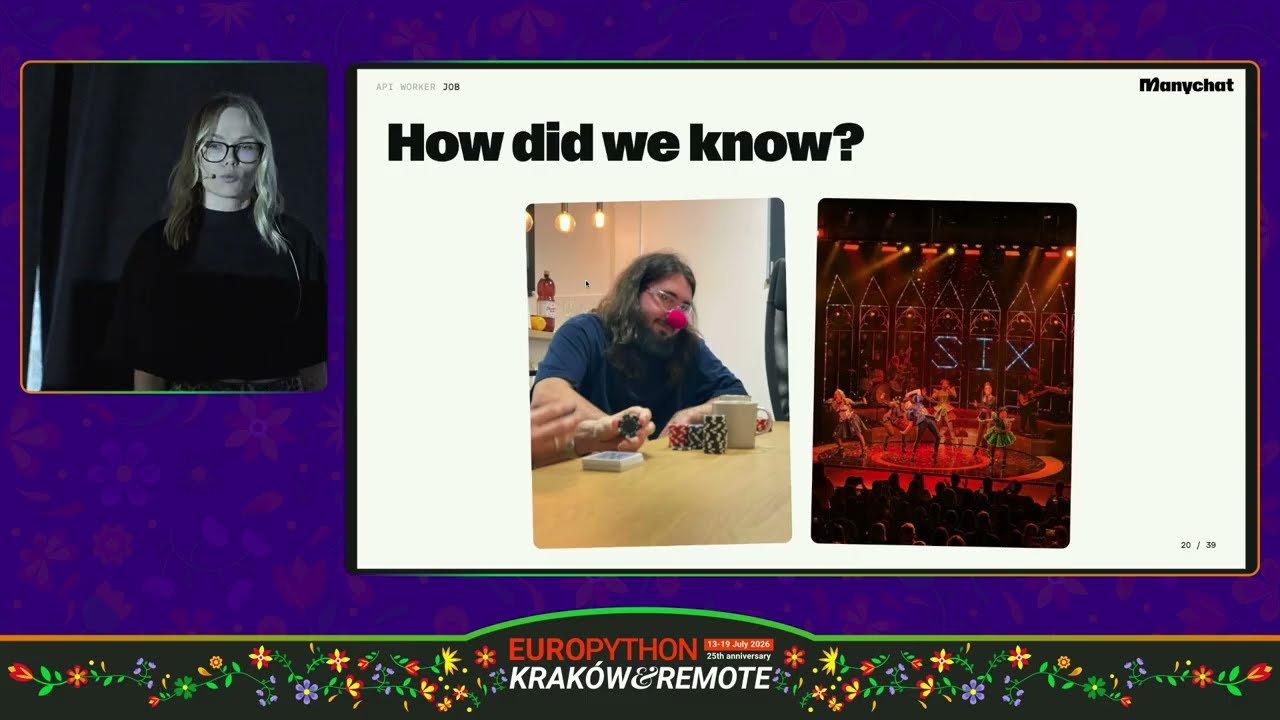
this? So uh my teammate Arthur he was at
the poker tournament. I was on my way. I
was sitting in metro on my way to watch
and enjoy the musical about six wives of
Henry VIII when we got Slack message
from our colleague. Hey guys, uh is
something off with the data? And here we
go. So I looked at our dashboards. At
least this panel we already had. Uh and
yeah, zero process rows. Um
so um
there goes the evening but what will you
watch for schedule job and well it's
refreshingly simple just take this
checklist follow it from top to bottom
and the first no will tell you what's
wrong and where to look
um so uh let's a little bit wrap it up
so um I showed you three different
workloads uh three different uh types of
failure and here I would also would like
you to take away with you that uh please
don't look at one single uh signal uh
look at them in combination because one
signal can rarely tell you the whole
story.
So, so far all of these uh metrics
workload metrics uh they tell you
something is wrong but not why and there
is actually one more layer underneath
and this is how we learned this one. So
yeah, one day we watched our API latency
started uh slowly creeping up and I
already told you that uh we already had
latency dashboards. We saw this. We just
watched our numbers climb. Uh but we
didn't have well we didn't know what's
going on. Is it our code? Is it our
cache? Is it our database? So uh yeah
and we didn't have at that moment any
database metrics like uh no query
duration, no connection pool, nothing.
So you're just staring at our numbers
climb. And you can probably guess by now
uh another team told us. So um we were
um yeah it turned out that um our
database was completely maxed out. So we
just were staring at the symptom with no
way to see the cause. And here is your
main takeaway. Please use your
application metrics together with
dependencies metrics. uh keep them side
by side. So every time when you see the
symptom you can see also um which
dependency is involves involved and uh
please start from what your users feel
and then you can follow it down to the
cause and please not the other way
around. [sighs]
Um
okay
so it was all about metrics. Metrics
tell us uh something is wrong. But how
do we usually see that? And most likely
you already know these three
observability pillars. Metrics tell you
something is wrong. Uh logs will tell
you what actually happened and traces
will tell you where it happened.
Um so let's have a look how they
magically work together and I will show
you kind of actual uh investigation. So
let's imagine that metric uh metrics
pages 500s on recommendations endpoint.
So you see something is wrong. Then you
look at the log for that specific window
and you see some event request failed
and now you know what happened but you
don't you don't know why database is
timing out. So you pull the trace ID
from the log and you see that 90% of the
request is waiting for one slow database
query. But where did we start? We
started from logs.
Uh and when we inherited our system logs
were just uh let's say humanish uh
sentences. We couldn't search through
them. We couldn't filter by any
properties inside. Uh so the first thing
I did I made them structured. So this
line became an event uh with uh specific
fields. Let's say uh just as an example
event service name environment error
class that will pay you over 100 times
correlation ID. So you can follow the
one single request through every line it
produced and traces. But here really
guys I don't recommend you to add
tracing first. First build uh the whole
uh foundation for of your uh system
observability and then you can add
traces and minimal viable traces should
be enough just spans at the boundaries
that really really matter request in
database query cache call external call
event in or out and then should be
enough.
So yeah, three pillars, structured logs,
metrics that can uh answer real
questions, uh viable tracing just uh to
kill the guess work, but really no
observability perfection is needed.
Um
so so far we talked about metrics,
traces, logs, but they just sitting
inside. They are waiting for you to come
and have a look. Um so we definitely
miss something that will come looking
for you and uh yeah I will just remind
you our three incidents uh API latency
just started creeping up uh zero
processed rows by our schedule job and
uh third one yeah our database melting
down. So
what's the score? Three new three times
we got notified by somebody else not by
our system. So zero by our system and uh
good alert would fill this gap. But what
makes an alert good? Uh and I would say
that this is really kind of simple
definition again. Um good alerts will
well should fire well when something is
really really broken and uh uh you
should act immediately like right away.
But here is the trap that usually team
fall into twice. First uh no alerts at
all. So you're flying blind
and uh then you overcorrect and uh you
create alerts basically on everything
and then you become a guy who cried wolf
uh and this is alert fatigue uh real
relability risk
uh and also two more things that I would
like to uh highlight here. So when the
alert fires please provide context
what's broken since when uh put link to
dashboards where you can start looking
uh put the link to run book so you will
know where to start actually what was
the last deploy and also start with just
few alerts that you can really really
trust and then grow slowly.
Uh so probably you already got over
overwhelmed by all of this. I also
already tired of talking but uh here is
the last thing that uh I would like you
to
tell. So um
that's a lot. I mean metrics uh traces
logs alerts this is really a lot. So you
need um
so uh but it doesn't mean that you need
to make everything all at once and I
will provide I will give you roll out
strategy so you will just apply it and
from the day one how does it look so
five phases and each one answer one
single question here I need to use my
cheat sheet because I don't remember the
questions. Sorry. So, uh the first one,
can I even see this? Is it failing
loudly? Just use health readiness uh
error login correlation ID and uh it
should be already enough for the phase
one. Second phase is uh uh is it doing
useful work? So add workload specific
metrics. Uh phase three add uh high
confidence alerts and uh so you will
know where uh how to act what what to do
uh you will know something is broken and
uh together with the fourth phase uh
provide dashboards and run books so you
will become real investigation and as I
mentioned uh earlier tracing this is
just fifth phase um
not not the first remember
uh and so you will connect the dots. So
this is basically the rollout order we
took but we did it really the hard way
possible because uh we applied it to the
system that was already on production
quite critical and running but you don't
have to. So take this checklist as a
gift so you can follow it from the day
one really and uh then your prototype
will not get promoted with
uh prototypes monitoring uh to
production and uh yeah this is where
your firefighting will not even start.
Uh yeah one more thing. So everything I
showed you today I wish I really I had
it on the day one because it would saved
us from bunch of incidents uh from few
ruined evenings and my colleagues would
love me even more I think. So uh yeah
observability doesn't mean that nothing
will ever break. Things will break. They
always will, but you will know where,
why, and what to do about it. Uh so uh
yeah, take care of your future self. Um
because or whoever will inherit your
system after you. Uh because yeah,
knowing what's going on is always way
better than getting in the dark under
pressure while your customer is waiting.
Uh
yeah and everything I covered today uh I
written up in my uh in two parts of my
article. Please scan it, read it, steal
it, then say hi, come to many chat
booths and uh yeah, probably you got
lucky enough maybe I will even show you
our dashboards and alerts that I set up.
Who knows? So yeah, I would like to hear
your uh production war stories. let's
say. And um one last thing,
every move you make, every step you
take, I'll be watching you. And now I'm
pretty sure that Sting wrote this song
about observability because we are all a
little bit of stalkers of our own
systems, the good kind. Thank you.
[applause]
HERE
we come.
>> I don't know guys if you have questions
please ask. Uh if you don't uh don't
but
>> okay. So uh thank you. Thank you very
much. If you have questions you can just
cue on the mic. The mic is here
and um
>> yeah but anyway you can
>> it was a great presentation.
>> Yeah, thank you. I think so too.
>> [applause]