SA-TIED Seminar Rethinking corporate tax and what the global minimum tax means for South Africa
Watch on YouTubeVideo summary
A recent study analyzing corporate income tax data from sixteen middle- and low-income countries, including South Africa, reveals an inverted U-shaped relationship between firm size and effective tax rates, where small firms pay less due to losses or preferential regimes while the very largest firms pay significantly below statutory rates. This disparity is primarily driven by special economic zones, specific deductions, and tax credits rather than loss carry-forwards or reduced statutory rates, costing governments approximately 1% of GDP on average despite most nations maintaining statutory rates above 15%. The research methodology utilizes full population tax return data to define effective tax rates as net liability divided by economic profit, noting that while a broad domestic minimum tax applied to the top 1% could substantially increase revenue in countries like South Africa, the actual impact of the OECD's Qualified Domestic Minimum Top-up Tax is expected to be lower due to scope limitations and generous deductions regarding payroll and tangible assets.
The Global Minimum Tax applies specifically to large multinationals with global sales exceeding €750 million and relies on a mechanism where the country hosting a low-tax affiliate taxes it first, potentially voiding claims from other jurisdictions. In South Africa's specific context, while the current corporate income tax top-up is modest at around 1.6%, it could rise to slightly above 2% if deductions become less generous or if tax credits are made refundable, though potential gains remain limited because only a small number of firms fall within the rule's scope. However, indirect effects from reduced profit shifting in low-tax jurisdictions could significantly boost revenue for higher-tax countries like South Africa, potentially doubling corporate income tax revenue to between 3% and 4%, making the agreement a significant step toward coordinated global policy even if some aspects face implementation challenges regarding competitiveness concerns.
The discussion highlights that large firms often receive disproportionate tax incentives compared to SMEs, a phenomenon not fully justified by efficiency costs, suggesting that funds might be better spent supporting startups and younger firms rather than sustaining indefensible disparities in industrial policies. In response to the risk that an aggressive domestic minimum tax could drive foreign direct investment to neighboring countries adhering strictly to the 15% OECD standard, the speaker acknowledges this possibility but maintains that capping tax incentives rather than scrapping them entirely is the recommended approach to ensure transparency and evaluation. Ultimately, while refundable tax credits reduce the revenue potential of the Global Minimum Tax and weaken disincentives for countries to offer their own incentives, the initiative remains a crucial advancement in establishing coordinated global rules, even as debates continue on whether domestic minimum taxes will be widely adopted given the competitive landscape.
Read the full video transcript
chat and with that over to you Pierre.
>> Thank you. Thank you very much for
inviting me to the essay seminar series.
First let me say a word of how great I
think this series and and what has been
done at the treasury has been in South
Africa. It's really an example that I
site often now when I travel to other
countries meet with other partners of
you know what you can do when data is
open and yet very secure and you create
a whole a whole program. So we've been
lucky enough that you know South Africa
is part of this study thanks to thanks
to the the Treasury and the data lab.
But this is a wider study that had the
goal to inform especially in light of
the global minimum tax that has that has
now been implemented by some countries.
What is likely to happen not so much for
rich countries, not so much for tax
heavens, we often talk about these two
two groups, but for the actually the
majority of countries that are neither
the rich countries with a lot of
multinational headquarters nor the tax
heavens that have benefited immensely
from uh from profit shifting. And so
this is joint work with my colleague at
the World Bank and Brock Meer, with
Royal Dom who's now at Bugal the Think
Tank, and with Kam Se who's finishing
her PhD in Munich.
So as you I'm sure know the corporate
income tax remains a key source of tax
revenue. About 20% of total revenue
comes from corporations.
Yet it's increasingly and it's been now
for a while let's say the past 20 years
under pressure and there's at least the
perception but the data is starting to
biting that large firms increasingly pay
less tax than they used to. What has
been discussed a lot is that
international tax avoidance and profit
shifting has allowed multinationals with
operation across many countries to
really take advantage of tax
differential
and in addition there's been competition
between governments trying to react to
this behavior and to attract firms and
so a race to the bottom in the statutory
tax rates that used to be in many
countries above 30% you know two decades
ago and in a majority of countries now
around 20 between 20 and 25%.
In addition and harder to study has been
effects on the base, right? So the rates
have been going down but at the same
time the tax base has typically been
narrowed. Yeah. Many tax incentives
which can be tax credits, income
exemptions, specific reduced rates,
special economic zones and the like.
And so we study this in the context of
the partial implementation of the 15%
global minimum tax since 2024.
South Africa is has signed the the full
OECD package. Uh and if I understand
well, I'd be happy to to to to learn
more in the discussion. It's becoming
really effective in 2026.
We have three research questions in this
paper. The first is to what extent do
tax incentives actually lower effective
tax rates of firms below the statutory
tax rate? How do effective tax rates
vary with firm size? And is it indeed
the case that larger firms end up paying
less taxes than medium-sized firms?
And then how much revenue might a
minimum tax raise? And then we're going
to talk about kind of a broad minimum
tax and then look at the specific rules
uh that apply to the global minimum tax.
So this paper really does three things.
It's first going to leverage full
population corporate income tax data
from 16 middle low and middle inome
countries. We we span quite a spectrum
of economic development. I would say you
know from the richest country might be
Greece in the data and the poorest uh
maybe Uganda or Senica.
We're going to measure for each firm the
effective tax rates in a way that can be
calculated that is relatively consistent
and comparable across countries. Right?
So we're going to be able also to make
some crosscountry comparison.
We're then going to look at how these
effective tax rate vary as a function of
firm size along the distribution. Are
there some generalizable patterns and
which types of tax incentives might
explain the differences in effective tax
rate and then we'll estimate the revenue
potential of the 15% minimum tax. And
let me give you a preview of some of the
key results. We'll go in detail. First,
there's a very clear effective tax rate
firm size relationship which displays an
inverted U-shaped pattern. Right? So the
smaller firms typically pay less taxes.
Tax rates increase for the midsize and
upper midsize firms up to about the top
dile and then at the top start falling
and actually drop quite a bit at the
very top of the firm size distribution.
That means that the top 1% firm pays
typically 2.5% less effective tax rates
than another firm within the top 10%.
Right? So we're comparing the very large
firms to the upper upper middle large
firms.
We'll see that there's different
explanation for why the effective tax
rate is lower for small and larger
firms.
Second, you know, we can quantify what's
the fiscal cost of corporate tax
incentives. It's large. It's about 1% of
GDP on average from the micro data. You
know, so in some countries, it matches
very well the tax gap analysis that have
been done. In others uh we have some
differences and you know we could
discuss why uh this is really fully
micro database and there's also some
limitation. I'll show you how we comput.
But maybe more importantly for the
debate on the global minimum tax we
notice quite a consistent feature that
in most countries and all these
countries have tax rates that are always
above 15% statutoily typically around
25%.
Yet a quarter of the largest firms are
currently paying less than 15%. Okay, so
that kind of gives you an idea of what
is a potential
taxable base of low tax profits uh in in
the countries we study.
Yet we're going to see that despite
this, the expected revenue from
a global minimum tax, consistent minimum
tax, and I'll bring you the acronym that
people use, QDMT, which you might have
seen, qualified domestic minimum tax.
It's actually a lot smaller than what
the numbers above make you think. This
is due to a much more limited scope,
which firms it will apply to, is due to
some deductions called carveouts. It's
also due to consolidation at the group,
right? And so we'll see and we'll try to
decompose uh a little bit some of these
effect.
So that's it for the for the preview. A
quick word on the on the literature. So
there's a big literature by now on tax
minimization strategies often focused on
tax evasion and avoidance. We're going
to look let's say at the third uh
element which is legal tax incentives
actually provided by the government but
that's a big reason why in practice
effective tax rate can be can be low
>> certainly in 2025 between the US
>> I'm sorry there's a yeah there's some
noise in the background yeah thank you
um
the question is we have some evidence
that tax evation typically decreases
with firm size in particular because
there's a whole set of third party
information that can be collected by
larger firms, think banks, think
suppliers and clients and so on. So it's
much easier for smaller firms to hide
their income. However, tax avoidance
tend to increases as bigger firms have
access to more sophisticated technology
might be multinational and able to to
shift profits around right the relation
between tax incentive and firm size have
been relatively unexplored. I think
that's one of the big contribution
showing that that's another reason why
tax rates are really not uniform uh
across firms.
And finally, what does it mean for
corporate tax collection? Well, despite
where I said the corporate income tax is
becoming seemingly less important
because of all these uh feature to the
law in many countries, a lot of the
revenue is still reliant on a few firms,
both the other corporate tax and because
these large firms retain taxes on many
other agents. And so it's very important
to understand what what would happen in
the context of a minimum tax. And so we
have this revenue estimation of the
impact of minimum tax. So let me move
now to the to to the core. Uh first a
few words on data and methodology. So we
have the full corporate tax return for
16 countries.
We have actually a good representation
in Africa. You can see Ethiopia, Ronda,
Sagal, South Africa and Uganda. and then
a very good representation of Latin
America
uh including big countries such as
Colombia and Mexico and then two
countries in Europe the Albania and
Greece. So you might wonder why this set
of countries it's not random. It's
partly the countries where we were
working and then countries either that
had data labs like South Africa uh or
that were very interested in
collaboration because they wanted their
own estimation. That was the case of
Costa Rica or Jamaica for example. Okay.
So you notice there's no country for
example in Asia that do have a lot of
tax incentives too. that might be a
reflection both of the limited data
openness in these countries or maybe the
less interest to to to consider um the
global minimum tax. Now just uh you know
to to to mention I mean several
countries have since actually reached
out and so while we're not going to
update the paper the analysis is being
done after about 18 or 19.
This group of country doesn't have a lot
in common except one feature. There's no
countries that people would typically
consider as tax heavens. What would it
what would a corporate tax heaven be? It
mean that the statutory tax rate itself
would be below the global minimum tax uh
of 15%. Right? So the lowest tax rate
country in this case is Albania with a
15% tax. But actually, and I'll show you
the rates later, almost all countries
have rates that are quite above the 15%
minimum tax, right? So the the median I
think is 25 or 26 in.
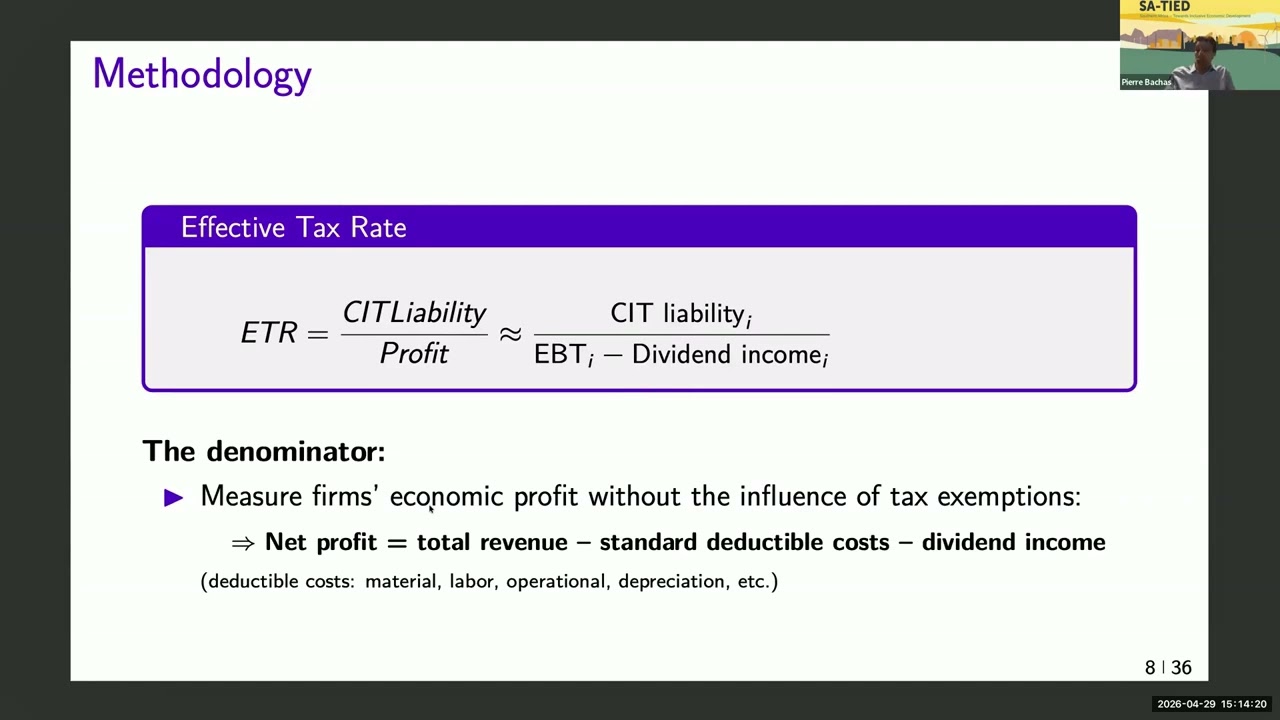
Okay. So what's an effective tax rate?
And here there's not one definition,
right? But first we can think of what's
the concept we like to approximate.
The numerator is relatively easy. We
want the CIT liability. That is the
taxes that are owed this year, right?
And here it's important because in the
tax return sometime you don't see
exactly liability. You see the taxes
that need to be remitted or owed after
some withholding or the deductions have
been have been already applied or
advanced payments. For example, here we
really want the total corporate income
tax liability corresponding to a given
fiscal year. And then we want to divide
this by a measure that should
approximate economic profit. Ideally, we
would have true economic profit. That's
not really something that exists. And
you know, we have to know that both
accounting data or tax data have biases
in what's being exactly reported. What
we do in practice is we try to
approximate it with something that has
the flavor of the
EBT that is a standard accounting
concept to which we remove dividend
income. Right? Right. So the way to
think of this is we're going to take
total sales and remove total cost and
the dividend income. So this is a
concept of profit that you know applies
before some of the key elements for
example income exemptions or special
allowances and deduction. And so
therefore it's going to be able to
capture
in the effective tax rate. It lowers the
role that all these special features of
the of the tax system uh imply for for
for the tax rate. Right.
It's important that basically in the
back of our mind when we're doing this,
we have the idea that there's kind of a
benchmark corporate tax that's the same
that people do when they do a tax gap
analysis, right? Which would basically
be to say there's a standard statutory
tax rate that should apply to everyone.
There's a standard set of allowed
deductions including financial
deductions. In this case, for example,
you can deduct interest, but anything
that's kind of a special allowance or
deduction on an exemption on income that
should that is not in in a classical tax
system. This is what's counted as a tax
incentive, right? And this lowers your
tax rate. Of course, you know, two
reasonable people could could debate of
what's the right benchmark, but most
countries actually apply relatively
similar definition to to to to their
standard corporate income tax and the
deduct deduction that should be allowed.
So here I repeat myself. So net profit
is total revenue minus let's call them
standard deductible cost which would be
material labor operational normal
depreciation interest and the likes.
Note that it's already somewhat of a
conservative measure because someone
could say well actually there's some
special provision linked to what
interest can be deducted and so on.
Right? So we think already by going this
if anything we may be underestimating
somewhat the importance that um tax
incentives and tax expenditure could
have.
This is what it looks like. Now you know
this is a little bit boring but so I'll
go fast over this. So we have total
revenue minus total cost and then that
allows us to get this approximation of
economic profit or losses for some firm.
Now this is different than the taxable
profit because the taxable profit is
going to remove exempt income. It's
going to allow for some tax allowances
for example some investment incentives,
some accelerated depreciation or other
special deductions.
There's something important though that
I need to mention which is in our
calculation it's very hard to remove
systematically loss carry force that is
losses that have happened in previous
periods and that are being brought
forward. So this is one important
limitation is that what I'm going to
call tax incentives typically has built
into it the loss carry forwards because
we couldn't do it in a systematic way
across all countries without and you
know if you're interested we can discuss
a little bit more in the chat why um but
I'll show you that for the main results
especially for the patterns this is not
key right so it matters a little bit for
the levels of total tax expenditure but
not for the patterns actually then
what's the next type of tax incentive a
firm can get well it's a reduced rate
right most firm will have this type or
normal rate. But then some firms are
going to be applied a reduced rate.
We'll count that as another type of tax
incentives. That's going to generate
right the taxable profit time the tax
rate the gross tax liability of the firm
to which now the firm can also apply
some special tax credits. So there's
some investment credits, some export
promotion credits and so on. Now once
we've applied those credits, we end up
with a net tax liability which is a
numerator.
And so I repeat, the effective tax rate
would be this net tax liability divided
by profit. Anything that looks more like
a double tax payment, for example,
foreign tax credits, right? These are
taxes supposedly you've already paid in
in other countries are not going to be
counted in a net tax liability, right?
And that's important because depending
on the tax form they might appear in
different different places, right? So
our goal is to again be relatively
conservative in in our approach.
The second measure we're going to show
you systematically is firm size. Now
firm size people a bit might have
different opinion what's the best way to
measure it. The way we could do it in
every country because it's always
reported and in a standard way is just
to use total revenue. In the paper we
show alternative for example to total
assets that's available in about
twothirds of the country of payroll
really the results are not don't hinge
much on this right anytime I'm going to
show you firm size I'm never going to
make a comparison of firm size across
countries it's always going to be within
countries I'm going to look at the
largest firms that operate within a
country and we're going to rank firms as
a function of their size within their
country right so when you're going to
look at the top you're going to look at
the top 1% firms for example in South
Africa relative to other South African
firms. I'm not going to I can't make a
direct comparison of these firms to
those say in Uganda.
I'm going to go fast on this. It's in
the paper. We have validate this or try
to validate with the treasury uh that
this was the best approximation we could
do from the variables in the in the in
the data lab um from the treasury. But I
would be very happy again to get
feedback on if there would be some way
to to potentially improve
So what does it look? The first thing we
can do is just say let's now plot rank
within rank within each country the firm
by size. The gray area in every case is
going to be those top 1% largest firms
where now I've zoomed on the top 1%.
Right? So the rest are basically
percentiles going from 1 to 99. And then
I wanted to zoom in on the top 1% firms.
Why is that? Because they're so
important for the economy and for total
tax collection. They often account for
about 50% of total tax collection. So
what's happening the rate that applies
to this firm is reduced.
The second thing I want you to notice in
this graph I know there's a lot of
information is that we've plotted the
statutory tax rate that applies in each
of these countries right and so you can
see what I mentioned the lowest tax
country is Albania at 15%. And then you
can see that basically all the other
countries are fairly high tax rate
countries right so starting at you know
25 then Guatemala and 25 applied to a
lot of countries and then I've ranked
countries by the statuto tax rate all
the way to 30 what is that 34 for col
now this figure is a little bit specific
because I've allowed first just to show
you that the firms that have zero or
losses remain in this figure so they
have not been removed
Now, it's a bit awkward because when you
have zero profits or losses, you don't
really have an effective tax rate.
You're paying zero taxes this year. And
so, I've assigned I've imputed, if you
will, an effective tax rate of zero.
Right? So, in here, you have also firms
with zero tax rate that are
participating in this in this block. We
can see though a very quite clear
pattern that is actually applying to
most countries that is smaller firms pay
lower tax rate. You can see that the
effective tax rate rises almost
everywhere
and then typically peaks not everywhere
but in many country it peaks somewhere
around the 10th or 15th percentile you
know so let's look at Costa Rica where
it's very evident for example here Costa
Rica small firms are paying very low
rate it increases peaks at not too far
from the statutory tax rate maybe 25% or
so and then starts decreasing very
clearly for uh for larger we're going to
come back to South Africa uh in a
minute.
Now you may say it's a bit awkward.
You've left you've left in there the
firms with effective tax rate with a
with a losses or of or zero tax
liability. What about if you remove
those firms? Okay, so now I'm not
changing my x-axis. I still have all the
firms, but any firm that doesn't pay
taxes in a given year, I remove them.
And so if you want, there's no more
zero. There's only firms actually paying
taxes with a well- definfined effective
tax rate. So what happens? You can see
that in quite a few countries now the
relationship at the bottom at the left
part of the distribution has flattened
maybe not the best example. So let me
let me go back and find another one. So
let's look at Guatemala here. Guatemala
had quite a lot tax rate for the small
firms but now when I look only at the
profitable firm you can see that this
has become basically flat. Okay. So that
tells us that basically a lot of smaller
firms are lossmaking
and so that's why you know when I have
the zeros in there a lot of the small
firms are not paying taxes because they
don't report any profits that can be
because of tax evasion or truly because
smaller firms you know they're
discovering themselves they're making
investment and so on they're still in a
growing phase. Okay
the pattern that stays more consistent
though even here is that typically at
the top you still have a large drop in
the effective tax rate. Right? So we've
kind of flattened the curve. Now we can
do one more step of controls which is to
say many countries including South
Africa actually
have special regimes for smaller firms.
Often the tax rate might be a function
of their sales of their profits of a mix
of the two of their assets. So what
happens if you try to control for
statutory tax rate preferential regimes
dedicated to small and medium firms and
you can see now let's look back at Costa
Rica which we've studied once that was
what will happen in Costa Rica by low
smaller firms were having much lower
rates and so once you control for the
rates you see that actually small firms
now don't have a gap relative to their
own statutory tax rate yet you can still
see a very large gap at the top relative
to the statuto tax rate of the large
corporation
>> transfer and obligation
So what about South Africa? We can do
the same. I'm already going to start
with directly the profitable firms in
South Africa. And I'm going to plot the
statutory tax rate. I think the year we
use if it's 19. I think the rate was 28.
I think it might have come down to 27
now. And so this is the effective tax
rate already for profitable firms. But I
told you we could control. South Africa
has a special regime for small and
medium enterprises
if we you know which so so it looks like
this and so if we control for this now
we can do the gap between the effective
tax rate and the statuto tax rate we've
basically erased it for about 80% of the
distribution but then you can see that
there's now still a big gap that appears
for the top firms right for the top
actually about 20% of firms in South
Africa and that is pretty large within
the top 1%
So
you might ask you know there's a few
things you do how robust it is to
controlling for sectors to computing
this over multiple years. You've talked
about losses. So I want to show you a
few things. So because it's very hard to
do it to show you graph for every
country. I've created here basically a
synthetic country. What does it mean?
You take I've taken the average at every
quantile every percentile of all the
countries in the day. Okay. And now you
see this pattern quite clearly that when
you take this synthetic country this
average of all the countries in the
sample smaller firms are paying more
around 20% in in effective tax rate this
rises for this let's call them upper
middleiz firms you know around the P80
P90 of the top distribution so those
those are firms that are not small but
they're not the largest either this
rises to about 23% and then you can see
it decreases quite clearly to the point
that the very largest firm in the sample
are paying even a bit less than the
small firm. Okay. Now once we've done
this it's easy to do some decomposition
for example to look at how it varies
across sectors
I've separated in the four key sectors
if you want primary which is agriculture
secondary which would have the industry
uh retail and service right and you can
see I think two two patterns are
interesting first the general pattern is
quite consistently there but especially
the big drop in effective tax rate at
the top of the distribution is very
pronounced for industry Right? Probably
won't surprise you. It's part of the
special economic zones and other things
to try to attract capital. It's also
though quite present in a sector like
services, right? So you can see a fair
drop in service.
What about if we build the effective tax
rate a bit differently? Instead of
building it on one year, one year of
corporate tax return, we actually take
the average across something like five
years. That means I'm going to take the
total tax liability paid over five years
over the total profits and losses
accumulated over five years. Know that
when I once I've done this, I've really
unless a firm is constantly making
losses, I've really kind of averaged out
the role of of losses, right? And of um
of loss carry forward and the likes. So
what you see when we do this is that
basically now that explains a lot of
also the reason why smaller firms are
paying lower tax rates and um and it's
in part because they're also claiming
some of these loss carry forward. We
flattened the bottom of the distribution
but we have not done much at the top
right you can see that the top this drop
in percentage relative to the the P90 is
very small okay so loss car for matter
for small firms in explaining why they
also facing lower lower tax rate uh but
not so much at the top
uh what about South Africa I just wanted
to show you the same graphs what's
happening in South Africa
the drop at the top you can see is quite
clear in the secondary sector maybe a
little bit in services too not so much
in retail and and in the agricultural
sector similarly in South Africa if you
build the effective tax rate over
multiple year of data you see that while
it raises a bit the levels it really
doesn't change anything to the pattern
right these two terms
now you might wonder you know is some of
these due to reporting at least at the
top of the distribution so here one way
to say that we think this measure is
pretty good is that if you look at
something like net profit over assets
and now we're going to basically make
the assumption that assets is a
verifiable relatively well-reported
variable. You can see that this ratio is
very constant across firms, right? So
it's not that there's some funny
reporting going on when you look at the
very big firms relative to smaller firms
that maybe are not reporting as well.
So let me move now to try to explain a
little bit uh what's going on at the
very top of the firm distribution. what
tax incentives explain this drop
especially we're going to focus on a
very simple model just say decompose the
effective tax rate with a dummy for the
top 1% firm right so I've put P99 these
are the 1% largest firms in your country
and to make this interesting because I
really want to focus on the top I'm only
going to keep firms that are in the top
10% anyway so really I want to make a
comparison within large firms but what
explained that drop at the very top in
that gray zone when I was showing you
the
And then what we're going to do is just
add controls one by one in this model
from different tax return variable that
could be explaining or mediating this
effective tax rate firm size
relationship.
Very concretely, I'm going to add a
dummy for if there's exempt income, if
there's a reduced rate that applies to
this firm, if they have applied for tax
credits, if they apply for loss carry
fors, and then some firm characteristics
that we can observe in systematic ways
such as sectors and geography.
So this is the table. Let me a little
bit summarize it for you. So we start
with the baseline that dummy of the one
top 1% average across countries which is
minus 2.2, right? So the top 1% firms
relative to the other firms in the top B
size, so relative to also large firms
are paying 2.2% less effective tax rate.
You can see that in 14 of the 16
countries in the data,
this is a negative coefficient, right?
I've averaged it, but it's negative in
14. And here is the inter intal range
across countries, right? So at the P25,
it's -4.2. At the P75, it's -0.
The first thing I'm going to do is put a
set of dummies for firm characteristics.
They're quite simple. The geography and
sectors I'm going to show you later
discuss a bit geography matters because
in some tax returns we cannot directly
observe special economic zones and we
think this is capturing that right and
so you can see that once we've put a
dummy for geography and sectors there's
quite a big drop in this dummy for the
top 1% right. So now if you control for
this there's only a preferential
advantage of top firms of 1.46
percentage points. The next column is
going to put a special damage for tax
allowances, special deductions. You see
that this drops a little bit the
coefficient but not by so much. Then we
have reduce rate. This almost does very
little, right? And that's normal. It's
rare that the very largest firms have
reduced rate except if they're part of
special economic zones.
Then we have a dummy for uh oh I think
this has been reversed. Sorry
that's a mistake because it's the tax
credit dummy that is oh no no sorry I'm
reading I'm reading my own graph wrong
with those little crosses. Sorry. So
it's the tax credit dummy that is doing
a lot of the lifting. Right. You can see
in column six um where now the
coefficient has dropped to minus
1.54
and finally and something important I've
mentioned you what happens when you put
the loss carryover dummy you can see
that it basically doesn't change very
much the baseline contriution right so
loss carryover matter for the total
level of tax expenditure you're
measuring but they don't mediate the
relationship between firm side and tax
expenditure in the final model I can
throw in all of those dummies together
right to see How much we explain? We
explain most of this difference not not
it fully in particular because you know
our model is a bit simple. These are
just dummies and not continuous measures
and so on. But you can see that once
you've accounted for all these type of
tax incentives or characteristics you
you've mediated most of these gaps. So
let me summarize maybe in in in a few
words what we seeing here. Top firms in
14 out of 16 country have an rate
advantage.
I've shown you the gap for the advantage
of the top 1% but actually if you focus
on the top 0.1% even larger from the the
gap becomes even larger and closer to 3
percentage point and then which types of
tax expenditure might explain this gap
tax credits matter a lot about a third
of the advantage of larger firms and
then firm characteristics account for
another third and in some countries
where we can see this it's basically
mediating for special economic zones
that offer a lot of tax advantages but
often are not direct not always directly
observable on the T.
Now I want to put two caveats which
might come back in the discussion.
First, there's a limit to observability
of tax incentive especially if you want
to do this in a totally systematic and
comparable way across country from the
tax returns. The reason is that many
incentives on the tax return
>> many incentives on the tax return they
come in with maybe in one place of the
tax return and they come in all together
to actually observe them and observe the
rationale and so on. You will need the
annexes that we have only in a handful
of countries they much you know sometime
they don't even digitize or fully
digitize this data. You also will need
details on the law because often on
these annexes what you will have is you
know we're claiming low number 1534.
Okay. So what does that correspond to
what concept and right so it's very hard
to do this in a comparable ways across
many countries and so that's why we
didn't go I've already discussed it's
also difficult to remove the impact of
past losses.
So what about South Africa? South Africa
we can do the same type of
decomposition. Uh the gap between the
top 1% and top the rest of top 10% is
minus0.9%
in South Africa. So not as large. But
there's something I want to show you for
South Africa which is this is really a
bit of an underestimate because if you
go back to South Africa here
South Africa compared to other countries
the drop in effective tax rate starts
much earlier in the distribution. So in
other countries we saw that you know
this gap was pretty flat up to the P90
and then started to drop in South Africa
start dropping already from the P8
right? And so that means that in the
comparison I'm doing in this table, I'm
really comparing, you know, firms here
at the P90 or P95 to firm at the P99.9.
And so you see that's why this gap is
actually mediated. The true gap and we
could we do this exercise for South
Africa to be more accurate should be to
take firms maybe at the P80 and look at
look at what's happening to top firms.
Okay. Now we can still ask you know what
about the very largest firms what's
happening in South Africa. What's
explaining the fact that they have an
advantage? What's quite significant is
special economic zones in South Africa
where I know there's a reduced rate I
think of 15%. Um we can see that exempt
income is also going to explain a little
bit but not as much actually of of the
variation. But then special deductions,
special allowances are really what's
explaining most, right? And once we've
accounted for them, we can see that this
dummy on the top 1% actually if anything
is now positive, right? So if you look
at how the coefficients changing here,
the two things that are really making it
drop is special economic zones and
special detach.
Uh and then you know in the paper we've
listed some of the main incentives. I
think this is not by size but by the
number of firms claiming it. uh and you
know you some of you probably know this
a lot better than me but these are the
key um provisions um that that that
explain this gap in the in the effective
tax rate. So I have 10 minutes now to
try to cover maybe a little bit less uh
the global minimum tax. So first we can
do a very simple extract now that will
compute the effective tax rate for all
firms and including for top firms. How
many of these firms are paying a low
rate? Now what does it mean to pay a low
rate? depends on each country but the
global minion tax asset low rate at 15%.
And so we can see across country what
share of the top 1% firms are paying
less than 15%.
So that's the figure to the left and I
think really this is quite a staggering
figure because you can see that maybe
with expression exception of Albania
none of these countries the low tax rate
country right all these country have
statutory tax rate of 25 27 28 30%. Yet
in all countries you have at least 10%
and very often 20 or even 30% of the
largest firm that currently face an
effective tax rate below 15%.
So that gives you an idea of a potential
pool of under tax profits. Of course
these are all firms not just
subsidiaries or multinationals as long
as they part of the top 1%.
And so we can do a very simple exercise
which is to say imagine you actually
apply a domestic minimum tax that just
says all firms all large firms you have
a threshold that applies to the top 1%.
That are currently paying less than 50%
have to pay a minimum of 50%. This is
not a totally crazy policy. For example,
Colombia has something very similar to
this and already implement and
implemented it last.
How much revenue could you collect? So
the figure to the right is showing you
the increase in the corporate income tax
relative to baseline
that this simple domestic minimum tax
policy could bring. And you can see
right here we have a bit more variance.
It depends on you know on how many firms
uh and on on the stock of profit. But
you can see that in a lot of countries
this is not trivial. We're talking about
substantial revenue if you were to tax
this low tax profit. Where is South
Africa? South Africa is about at the
median, maybe a little bit below with
potentially about 10% higher corporate
income tax collection if you were to
apply such a broad-based domestic
minimum. Now, in practice, the global
minimum tax is very different, right?
So, it's been called a milestone in the
regulation of globalization, a corporate
tax revolution by the financial time.
It's an agreement of about 140 countries
for 15% minimum tax that would applies
to large multinationals, right? So
there's a threshold of global sales that
the multinational has to to reach and
then the tax rate would apply to all its
subsidiaries.
Who has implemented it? most high-
income countries with the exception of
the United States and a set of low and
middle inome countries which includes
South Africa which includes Brazil and
then other countries considering it has
a set of quite smart connection rules
that let's you know we can review
quite quickly and then I'll come to our
exercise right and the idea of this rule
is that you have an ultimate parent
entity that might control an
intermediate parent entity that itself
has a set of affiliates that might be in
low tax places and other in high tax
places. Low tax and high tax in this
case is determined by the effective tax
rate that the subsidiary is paying in
the country. So anytime it's going to
pay less than 15% in a country, it's
going to be considered a low tax appeal.
Now there's three set of rules in the
global minimum tax. The first one is
this qualified domestic minimum tax.
It's saying the country where the low
tax affiliate subsidiary is is located
is allowed basically a first bite of the
apple. Concretely can apply and decide
to tax this firm up to 15%. And then
this voids any other taxes or claims
from other countries. Step one and
that's what we're going to model. It's
important to know that there's two other
set of rules. One is the income
inclusion rule where the parent company
of the subsidiary is headquartered is
located and the parent company if
there's no QDMT is allowed to say ah
actually I'm going to collect the
missing profit from the headquarter
country. Now what about if the
headquarter country doesn't do it then
there's a third rule
which is that countries where other
affiliates all the subsidiaries are
located which are already overt taxed if
you want tax more than 15%. they're now
allowed to go and claim the under tax
profit in the low tax countries to a
proportion of how much of the worldwide
sales they have of of the okay so this
means that really countries if if this
whole mechanism is well applied most
countries should choose to enforce the
QDMT because this way they're the first
to tax otherwise their subsidiaries in
their countries are going to be taxed
anyways but either by the headquarter
country or by countries which already
taxed uh the same multinational
subsidiaries that are higher. Okay. So
in terms of data, what are we going to
do and I'm going to accelerate here a
little bit. We're going to do two things
in in a subset of countries where we
could do this.
Something very important is we need to
identify which firms are affiliate of
multinationals and of those largest
multinationals. We're going to ask a set
of partner tax administration to match
the data set with Orbeez. Orbeez is this
private data set but that is pretty good
for having ownership links especially
for large multinational headquarter in
the United States or in Europe and so we
from that we're going to be able to
observe in the corporating contact in
each country which firms seem to be
subsidiaries of large multinationals.
The other approach now we're going to
get an imperfect merge when we do this
and so that means that we're probably
getting a lower bound of the number of
firms in scope. The second method we can
do is actually say we know from the
country bycountry report how many firms
are supposed to be in scope in each
country right so we know that there
might be 100 firms in what country so
what we're going to do is just use an
indicator for if a firm is a
multinational in a country when those
exist and just say we'll take the 100
top firms top foreignown firms as to
match the number of firms that appear in
the country by country
this is likely to yield an upper bound
Now because we've taken the top firms,
the ones with the highest top of tax,
right? So we're basically getting two
methods. One that gives us a lower band
and another an upper band. So let me go
to calculations.
Once we've identified the firms in
scope, right? So that's going to limit
the pool of firms. We then going to
calculate the tax base under what is
called globe, the rule of the global
minimum tax, which allow for some quite
generous deduction. you're allowed to
deduct 10% of your payroll and 8% of
your tangible assets. Okay? So the tax
base is going to shrink quite a bit. So
when we say it's a 15% minimum tax, it's
not really true. It's a 15% minimum tax
if you have no substance, no payroll, no
tangible assets. In practice, it's going
to shrink the the the top of tax. The
other thing that's important is one
needs to consolidate firms within a
group. Okay? Because this applies at the
group level within a country.
So we've done this for five countries.
So here are the five countries including
South Africa. And so first how many
firms become liable at the top you have
this uh the first method uh the the the
upper bound method at the at the bottom
for each country you have the lower
bound method and you can see that you
know it's not a whole lot of firms we're
talking about South Africa which is the
largest country among these among these
you know it's about 130 or 140 firms to
which we estimate this would apply
let me move on here and show you the
composition uh and I'm going move
directly to the South African kids.
Okay. So, we're going to move scenario
by scenario and say sorry I need to
remember the the legend. So, okay, I'll
do it for Costa Rica and then go to to
to South Africa.
So, first what happens when we only
considered
at the group level we've excluded small
firms in Costa Rica? We estimate that
the corporate income tax could rise by
24%. Now let's apply those deductions I
just told you about. Then we lower this
to about 21%. In practice, those
deductions actually are going to become
less generous over time. There's a
phasing out of those deductions. 10
years out, we estimate about a 20%
increase in corporate income tax. And
now at the bottom, we have two
counterfactual scenarios that we think
that are interesting.
The first one is what happens if all
your current tax credits
become what's called refundable.
So there's a provision in the global min
that says if if a tax credit is
refundable, meaning you're allowed to go
and the tax administration owes you
money in the end, then actually doesn't
count in the calculation. So if Costa
Rica was to transform it tax credit to
refundable, you see that basically the
global min would go to zero. The last
counterfactual scenario is one where we
look at what was initially proposed as
part of the global minimum tax that was
a rate of 20% and immediately the year
10 carve outs that are less generous and
you see that that would make actually a
difference then you would collect around
30% in Costa Rica. So what about the
same type of scenarios in South Africa?
So we started 1.6%. So it's not huge the
corporate income tax top up you could
get once we apply the deductions for
payroll and assets. You see that we've
have this and we have less than a
percent. 10 year out as deductions
become a bit less generous we would go
back to slightly above a percent.
Mechanically if tax credits become
refundable then there's no there's no
gains for South Africa and under a 20%
rate this would raise to about 2%. Okay.
So relatively modest
uh gains in South Africa because
actually the number of firms in scope is
not so large. So let me let me just open
this because I think some of these
questions you might have in the
discussion. We've documented large
economywide gaps between effective and
statutory tax rate. Tax incentives allow
large firms to lower the effective tax
rate quite a bit lower than that of side
firms. And the global minimum tax only
collects a modest fraction of potential
revenue especially when you compare it
to a broader minimum.
There's still many unknowns in what
we've done. The first is the
implementation of the global beon tax.
Which countries will adopt? What about
the US that is negotiating a sidebyside
deal that would partly protect US
multinationals?
If the global million tax works well,
it's also going to shape deeply firms
reporting production and maybe even
location decision especially out of tax
7. So that could be another type of
gains to tax revenue.
So that's on the global tax. On the tax
incentives and efficiency front, you
know, there's a question, why are tax
incentives highest for the largest
firms? Is this partially about take up
that small and medium firms are not as
aware maybe
and finally you know there might be in a
world where this is quite justified that
the relationship between firm size and
tax incentives can be explained by
efficiency cost but I think many
countries really lack good research on
that I think South Africa is actually
getting some research on that and that's
great and I think you know the the size
of the tax advantage really mean that we
have some of the most powerful actors
paying a lot less taxes than other
everyday firms you know and So we need
to be sure that this is just I'll stop
here and open for questions. Thank you.
>> Thank you Pierre. Um we've now moved on
to the we're going to move to the Q&A
segment of the seminar. I know that
we're joined by an who is one of Pier's
coers.
Um
to ask any questions you're welcome to
type questions in the chat or you can
raise your virtual hand. I see that we
already have one question in the chat
here and it is from Gossini Lamini. He
asks, "Is there a risk that tightening
effective tax rates at the top could
discourage investment particularly in
sectors where incentives are currently
concentrated?
If there any other questions, please
raise your hands. I don't see any hands
at the moment.
Yeah, I don't know if you'd like to take
that or should defer it to an
and do you want to answer this or
>> happy for you to go ahead.
>> Uh so this is a very good question. I
think that was our last point and
especially in a world that sometime you
know industrial policies kind of making
a comeback and so on you could say you
know it makes sense to protect our
largest champions right and so that
would be with lower tax rates.
I think though you know we've documented
that this is really systematic across
countries yet very few countries do this
type of real estimation of are our tax
incentives justified
and there's something a bit perverse
because a lot of countries are also
saying well we want to encourage
monomial firms to grow and so on and yet
you can see that initially the profile
of tax rate is typically increasing over
most of the size distribution right and
so you know these are complex problem
because there's issues of fairness,
there's issue of competition between
firms and so on. And so there's a world
where this can be justified, but I think
in most cases we don't have actually
enough evidence to to to to say so. And
I think that's really an encouragement
for more studies to go and say, you
know, does it make sense that it is the
largest firm benefiting or would you be
better off spending this money on
something else for startups of of, you
know, creating an ecosystem of actually
younger firms that eventually will grow.
Oh, we have one more.
Um, okay. We have one more from.
He asked, "Given that the estimated
revenue gains from the global minimum
tax are relatively modest for South
Africa, um, where should policy
attention shift if the goal is to
strengthen revenue mobilization?
So this is a very good question. You
know, we were a little bit surprised
because a lot of estimations are were
larger for the gains. Um so it's
important maybe to put some caveats. The
gains we measure are the mechanical
gains, right? They're literally applying
the higher tax rate. Some more positive
scenarios and analysis say by the OECD
or the international tax observatory.
What they have tried to do is say okay
but if these rules are really well
applied actually a lot of the profit
shifting motives putting your profits in
low tax countries are going to diminish
right and so that could mean that you
know a corlary of this is that there's
more reported profits in higher tax
countries which what we've seen South
Africa is mainly a higher tax country
even though it has some pockets of low
tax firms right so these indirect
effects they're very hard as you can
imagine to to estimate you But there is
a world where they are not trivial and
at least you know for South Africa they
might double you know to three 4% the
corporate income tax revenue right so so
that means that applying this rule is
not you know it's not just about the
mechanical effect it's also about
participating in this kind of global
public good that countries have actually
taken a decade to try to implement to
limit this profit shifting and I think
in that sense it does make sense for a
large country like South Africa to to
participate But I think what we're
showing is we should not expect you know
miracle increase in in in tax collection
uh coming from this. And so to your
question where does revenue mobilization
comes from? Well, it might come from
really rethinking some of the tax
incentives. If they're overly generous
and they're not reaching their purpose
and South Africa has many as we've seen,
that's maybe where there's an easier an
easier way to to to increase revenue
mobilization. But as your other question
said, you know, these have to be
estimated because some might be very
efficient and others not as much.
>> Thanks, Pier. And before we take another
one of the
questions, are there any questions from
the floor?
>> Okay, not
um the last one Pier is the analysis
uses.
>> There's a question by Hey, I think she
missed her. Oh, okay. Haley, I didn't
see your hand. Sorry. Please go ahead.
>> No problem. Um, thanks very much for the
presentation, Pier, and for the work.
Um, it's certainly been very interesting
for us. Maybe just a couple of comments.
I have quite a lot of it's a it's a very
interesting topic, and I could talk at
length, but maybe just a few points. Um,
on the incentives question, maybe let me
start by saying I'm not a fan of tax
incentives. I don't necessarily think
that they change firms tax behavior. And
from a South African perspective, we are
trying to evaluate uh their success etc.
and see if they're aligned with
government objectives and see whether
they whether they should stay in place.
I also think it's unfortunate with the
recent change in design of the GMT that
effectively, as you mentioned, one of
the measures that um that reduces
revenue potential is refundable tax
credits. Um, and it's unfortunate that
substance-based tax incentives and the
way that it's been watered down in
effect almost removes the disincentive
for countries to introduce tax
incentives. I think that's quite
unfortunate. Um, a question and and so
one of the things I guess is similar to
one of the questions you raised in terms
of the take up on incentives. The
question for me at least is does that
mean that medium firms don't take up
incentives and is it a question of tax
incentives being designed specifically
for large firms? We had an incentive in
place like that in South Africa that
that was removed because of that reason
from a fairness perspective and
competitive reasons.
um or is it that there should be better
information so all firms can take them
up and then a a quest it was also
interesting to see how the sectors are
different so for example the secondary
sector seems to have the bigger downturn
in ETRs for larger firms and I guess
that part of the GMT design where
there's a lot of substance then they
then they're not liable for as much
topup tax um and then a question for
interest on the domestic minimum tax and
you mentioned that Colombia IA is a
country that that has one of these. I'm
interested from a policy perspective how
likely you think it is that that
countries will adopt such a measure
given that they're obviously concerned
about competitiveness etc. Um and some
countries might there might be a view
that tax incentives are useful tool for
attracting investment. How likely do you
think it is that there would be a wide
ranging take up of something like a
domestic minimum tax? Uh thanks very
much. Sorry for the long intervention.
>> Thank you Haley. And you know first a
big thank for Haley that has helped us
has helped us a lot in this paper.
You've talked to us a few times and that
has been very valuable and something we
really appreciate also by the Satite
program
the fact that we've been able to talk to
to to people that came. So uh I mean I
think it's a great intervention. You
know better than us. I think you know
these issues need to take up. We know
that from some of the literature in in
in high income countries actually take
cap is an issue for small and medium
firms and if anything some of the papers
we have seen show that condition on take
up actually small and medium firms often
benefit more from incentives and then
that's actually where they're quite
efficient right so to that point of
efficiency if you could target it well
to these firms communicate them well
maybe that's where you have the bigger
bang for the back um I think you your
analysis in South Africa is right you
know It's
the fact that it's going mainly to firms
that actually have substance mean that
there's not a whole lot of potential for
the the global minimum tax. And on the
issue of firm size, we looked a bit at
the special economic zones and actually
there's a fair distribution of sight
within the special economic zones.
Right? So while this is a big tax
incentive, it's not one of the most
sight dependent in South Africa. And I
was a bit surprised when seeing this
number because in a lot of other
countries it's almost exclusively very
large firms that I know. So that might
be you know I mean I don't know enough
about that context but I know there's
some papers uh from essay tit on this
that I should read and there might be
more context and now you know to your
question what's likely to happen uh with
those refundable credits the evolution
of the sidebyside deal I think it's less
likely than a few years ago that
countries would want to do domestic
minimum taxes especially the kind of
broader ones that Colombia has
implemented
there might still be a case I think to
start doing more tax incent let's put it
this way more industrial policy maybe a
bit outside the tax system you know and
then we might want to think what what
that means right but sometimes the tax
system is being used because it's an
easy way really to connect to firms it's
often the the best administration in
many countries and so that's the way to
reach firms but it's really not clear
that lowering the tax liability is the
way to achieve goals if they're linked
to say employment or capital formation
right and so um on this I invite you my
colleagues at the World Bank have just
published a very big report on
industrial policy that you might have
seen it's generating some noise because
I know the the Financial Times and
others have said you know it's really
changing 30 years of of the Washington
consensus but you might find that
interesting
we are left with four minutes um I think
we've given
a bit of air time so I'm going to take a
question from Enoch he has two we should
have enough time to cover those. Um, the
first is which specific tax incentives
are the biggest culprits for the
U-shaped tax burden and should they be
scraped entirely or crap?
I guess yeah, scraped. Then the second
one pier is if South Africa implements a
domestic minimum tax that is more
aggressive than the GMT, do they risk
losing foreign direct investment to the
neighbors who stick strictly to the 15%
OECD standard?
Then I think we'll cap it at that and
>> and do you want to take those?
[clears throat]
>> Sorry, I was just typing a response to
Kosinaki's third question. Um
so I'll
>> okay so so so I'll try to answer not
question so so so thank you for the
question that's one you know we've we've
received a few times and I think that's
the limit of what we've done right we've
covered many countries and find a good
balance but I think in the end of course
when you're trying to reform those you
have to go very deep in the legislation
of each specific country right
we've seen that something that matters
are the tax credits in particular so I
would say within the cate categorization
is often the one that the large firms
are most able to to to
take use of. Often tax credits are
linked to specific investment behavior,
right? So you might think this is part
of kind of a negotiation for the firm to
set up in a country and so on. So I
think that ties back very clearly to
this efficiency question. Uh and so it's
very hard to answer your question.
Should they, you know, should they be
scrapped or I think I'd prefer would you
say it be capped? You know, there should
be a limit and there should be a lot of
transparency. there should be
evaluation, right? I think that's really
all the things that matter that
currently few countries have, right? So,
we've lived in a world of kind of lack
of transparency on everything linked to
tax incentives. Um, and so I think
hopefully that is changing slowly and uh
now I think you are right going more
aggressive means some risk for for FBI
that is that is certain. I think that
was the idea of negotiating a global
deal that everyone would apply, right?
It's really a coordination problem that
was partially
uh resolved. But as we seen, you know,
especially in this a bit more erratic
world that we are currently in, it seems
that some bits of this agreement are are
you know won't be applied. I still think
it's a big step forward and I'm really
happy that countries you know that South
Africa are choosing to implement because
we can there's many reason to criticize
the OECD global minimum tax too but it I
think it's a key step forward not so
much in what it's going to do for
revenues with but in the logic that you
can actually have a coordinated policy
uh with some global rules and we can
imagine later I don't know in five or 10
years if the kind of global cycle is
more prone again to cooperation that
this would be strengthened in a more
significant