Video summary
This midweek trading update from Michael Kramer highlights that market volatility is expected to intensify significantly over the coming days due to a dense schedule of economic data releases and corporate earnings. The primary focus for Wednesday, July 29th, will be the Federal Reserve's interest rate decision, with expectations that rates remain unchanged within the 3.5% to 3.75% range before their press conference. This is followed by Thursday, July 30th, which brings June PCE inflation reports and quarterly GDP figures alongside major earnings from tech giants like Meta, Microsoft, Amazon, and Apple. Kramer warns that this combination of events could create substantial swings in foreign exchange markets as traders digest the implications for future monetary policy.
In currency pairs, the Euro is showing signs of weakness against the Dollar after failing to retest a key bearish flag pattern, potentially heading toward 1.08 if expectations rise regarding Fed rate hikes later this year. The British Pound has also shifted from an uptrend and is now trading below its ten-day moving average, with support levels at 1.32 being critical; a break here could lead to further declines towards 1.30. Meanwhile, the Japanese Yen recently broke out of a wedge pattern indicating continued weakening against the Dollar, though this trend may face some nervousness if the Bank of Japan adopts a more hawkish tone during their upcoming meeting without raising rates immediately.
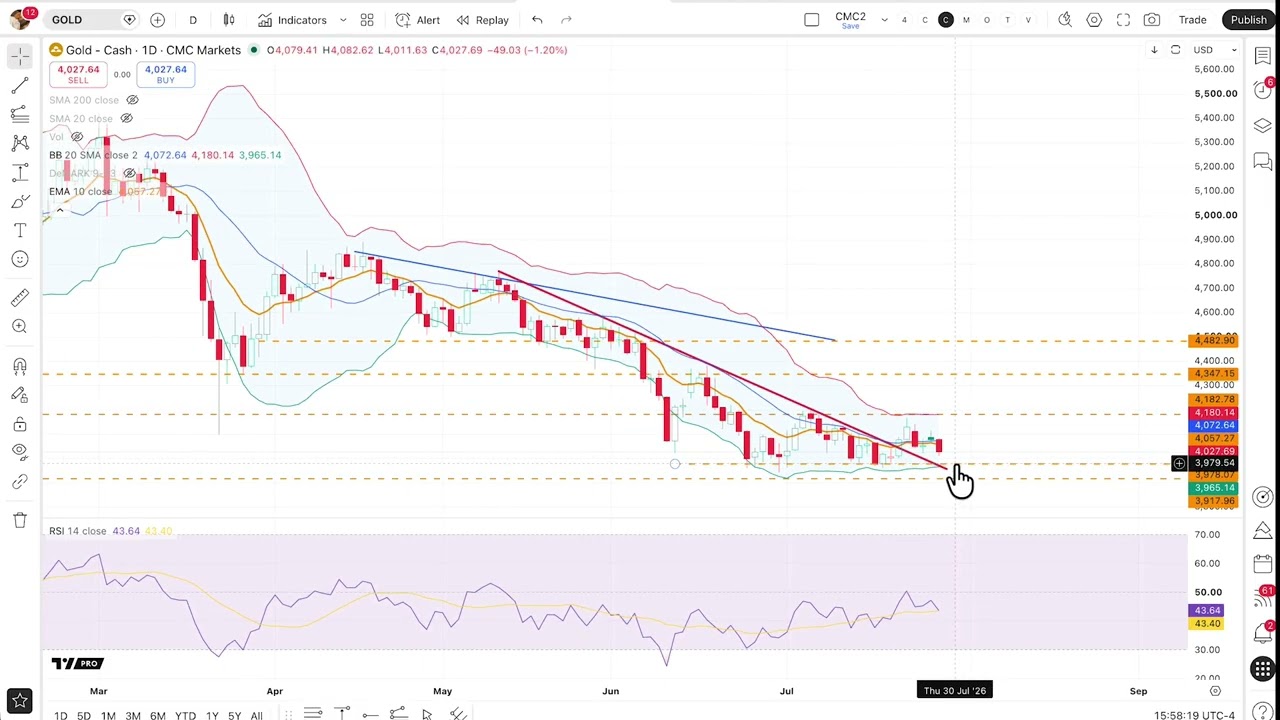
Commodities and equities present mixed signals with oil prices experiencing volatility due to Middle East tensions but currently holding support around $71 per barrel after reaching overbought conditions, suggesting potential for further gains as long as they stay above the 20-day moving average. Gold failed to establish a sustained breakout last week and is now trading below key moving averages, requiring a break of the $4,200 resistance level before upside momentum can be confirmed. In US equities, there is notable divergence between indices; while technology-heavy stocks like the NASDAQ 100 are drifting lower within a defined range, the S&P 500 and Dow Jones Industrial Average have shown more resilience or even breakout potential, with the latter clearing recent downtrends but facing resistance near its early July highs.
Read the full video transcript
Hi everyone, this is Michael Kramer of
Mach Capital. Today is Tuesday, July
28th and it's around 400 p.m. New York
time. So this week, uh, the news flow
will be picking up significantly.
Starting on Wednesday, July 29th at 2:00
p.m. Eastern, we'll be getting the Fed
funds uh rate decision. Uh the FOMC is
not expected to change rates at this
week's meeting. We're looking for the
range to stay within 3 1/2 to 3.75%.
That of course will be followed by the
press conference 30 minutes after the
announcement. Then on Thursday, July
30th, we'll be getting the June PCE
report. Uh for the month of June, we're
looking for core PCE to rise by 0.2%
down from 0.3.
Core PCE overear expected to decline to
3.3% from 3.4. Headline PCE expected to
fall by 0.1% down from 0.4%.
The year-over-year index is expected to
drop to 3.7%
from 4.1%.
Additionally, the same morning, we'll be
getting the second quarter GDP advanced
reading. Estimates are for it to come in
at 2.1%.
Uh GDP deflator expected to come in
3.9%.
And core PCE, this is a different number
than the monthly number. This is the
quarterly number that's expected to be
at 3.5%.
And that's basically going to round out
the economic data and the uh Fed meeting
on the 29th. It's also important to
remember that there'll be lots of
earnings data. On Wednesday the 29th,
we'll be getting earnings from Meta and
Microsoft. And then on Thursday, uh July
30th, we'll be getting earnings from
Amazon and Apple. So, uh there'll be
lots of big news events over the next 24
to 48 hours here in the US and that's
going to make markets volatile. Uh and
it could create pretty big swings in FX
as well. Um, we can see that the euro
has uh really traded a little bit lower
since last week. We haven't really
gotten to a point where we can say that
the euro has really broken down, but it
is making signs that that may happen.
You can clearly see again the bare flag
pattern that we had drawn in last week.
Now, we clearly uh did break below that
pattern and we've managed to come up and
retest it. Uh to this point, it has
failed. the ECB had a little bit more of
a dovish tone. So, it's going to really
be important to listen to how the Fed
positions itself. Expectations are that
they will be raising rates at some point
this year. And so, if that's the case,
we could expect to see the euro continue
to weaken versus the dollar. A
projection of this bare flag, if it
plays out, would suggest we might see
the euro trade all the way down to
around 111. However, there is some
pretty solid support around 10 around
112 and a half uh before we get there.
When we look at the British pound,
that's also weakening versus the dollar.
Although today it didn't. Uh you can see
here's your big uptrend. That's
obviously been broken. We're now seeing
uh the pound really begin to weaken
versus the dollar. It's now failed on a
couple of attempts to really get through
this 135 area unsuccessfully. our 10day
moving average. We're now trading below
that for a couple of days. So, the trend
appears to have shifted. Our lower
Ballinger band is the next opportunity
for support around 132.
But really, this 132 area is probably a
more important level of support. Uh
because again, if this level breaks,
we're looking at potentially trading
back towards 130 or so. Again, this is a
level that's held though on the last two
attempts. So, this will be something
that we need to watch closely. Clearly,
a breakout above the 10day exponential
moving average could push the pound back
on an upward trajectory, but as of right
now, it's probably more likely to be
resistance. The Japanese yen finally did
break out of that wedge pattern we had
identified. You can see that the
Japanese yen has generally been uh
continuing to weaken. We did find a
little bit of resistance around this 130
around this 16383 area. Um that is
around where the upper Ballinger band
is. Again, not really surprising. We are
getting some consolidation. RSI went
above 70. We did go above the upper
Ballinger band uh for the most part.
10day exponential moving average send
working as uh support. So, as long as
this continues to rise and the Ballinger
bands continue to expand, it's more
likely than not that the pound that the
uh yen can continue to weaken versus the
dollar. At this point, the only thing
that maybe changes that later this week
is the BOJ meeting. Uh again, they're
not expected to raise rates, but they
could take a more hawkish tone, which
could get the market a little bit
nervous about future rate hikes,
potentially leading uh the end to
strengthen. But as of right now, it's
been uh a little bit of a hit and miss
when it comes to what they're going to
be doing. So again, right now, the trend
looks fairly favorable. And there's
probably still room for this to move up
towards the 165 area. Certainly if you
just take a a measure a measurement from
here to here you can see that we could
get up to around 164 and a half uh just
based on this move alone. Oil prices
have continued to be very volatile and
the the the everything going on in the
Middle East is making that very
challenging even from a technical
perspective. We did reach the 61.8%
retracement level. We did reach
overbought conditions on the RSI and the
Ballinger bands. So a pullback seemed
fairly natural to take place after
climbing all the way over 100 on Brent.
But uh again right now you can see we
are trading below the uh 10day
exponential moving average uh with the
20-day moving average likely to be the
next area of support. There's also
appears to be some support in this $82
uh a barrel region as well. As long as
oil continues to hold above the 20-day,
I think you still have a a trend change
working and you can maybe see oil
continue to move higher. Uh again,
there's lots of different things going
on. It makes it very challenging, but as
of right now, support and oil at 71 is
held. So, as long as uh oil can start
keep making slowly a series of lower
highs, it kind of points higher. As of
right now, that's what's been happening.
Obviously, a break below 71 would
suggest something has changed
materially, but at this point, I would
expect that we probably find some level
of support between 82 and 84 and that
the trend continues higher for now. Gold
prices uh attempted to break out last
week, but that kind of failed. uh we
ended up seeing gold coming back down.
It wasn't really able to establish a
trend above the 10day or 20-day moving
averages. Um we can see we're now
trading back below it. So, at this
point, there's possibly a risk that this
is going to be a failed breakout. We
won't really know whether or not that is
the case until we see it break below the
3980 floor. That's been the area that's
been very important to gold and that's
the area that really needs to break to
give you confidence that there's going
to be potential for further downside. I
mean right now I guess if you draw a if
you drew a trend line you can make
another argument that there is a little
bit of a still a downward trend in gold
but this is kind of I think a weak trend
line at this point. Um, again, I I think
basically gold will need to break above
4,200 before you can really maybe start
to think that there's going to be some
upside. However, I think that's going to
be challenging only because you can see
the upper Ballinger band is solidified
at here at this level. It's going to
need to start to rise to give it room to
go up and you also have uh a pretty
solid area of resistance built up around
that 4200 region. Uh when we look at the
DAX that actually managed to rebound the
last couple of days with oil prices
coming back down again. The DAX has been
fairly tied to oil. I think at this
point again we're talking about the
upper end of the trading range somewhere
around 25,800.
That coincides with the Ballinger band.
It coincides with the prior highs.
Again, you haven't really seen the DAX
do very much now going back really to
the summer of last year. In fact, 24,500
was the level in June of 25. And all
we've managed to really do over that
time is see the DAX uh rise by about 4%
and just have a lot of volatility in the
process. So, there's not much to really
make us think at this point that we're
going to see the DAX uh materially break
higher. At the same time, I think
there's probably pretty strong support
in the 24,900
region, uh, with maybe room to go down
to around 24,400.
The Footsie uh, 100 has finally broken
out to the upside. You can see it's even
put in a a new high at this point. Um,
again, what we're seeing here uh is an
uptrend in in the Footsie. You clearly
have bullish momentum forming on the on
the moving averages turning higher. The
only thing the only um issue we have
here on on the Footsie is that you can
see we've stopped right above the prior
highs. Uh additionally, you can see
we're trading above the upper Ballinger
band. Um the RSI isn't quite overbought
yet, but I'd imagine if you got another
one or two days of moving higher that
that would happen. And so I think
there's probably a good chance in here
that we actually see um the Footsie
perhaps begin to consolidate a little
bit uh sideways uh before potentially
making its next move higher. Likewise,
if if this fails, I would look for the
Footsie to come back towards 10,675,
which coincides with these moving
averages and this uh area of support
that dates back to uh the spring. The
NASDAQ 100 has been drifting lower the
last uh few trading sessions. Uh and
right now it's kind of in an interesting
area where it managed to find some
support today around 27,700.
It's also worth pointing out that you
can see we're now trading below the
lower Ballinger band. The RSI is only
around 36, which suggests, like the
Footsie, only in reverse, that perhaps
you could continue to see the NASDAQ
decline along the lower Ballinger band
for a couple of more trading sessions
before you see the RSI put in uh an
oversold condition. Uh so clearly right
now a break of 27,675
would likely lead to the NASDAQ falling
back on the NASDAQ 100 falling back to
26,950.
Likewise resistance probably pretty firm
around 28,550.
That's where you have the 10day
exponential moving average. That's where
you have some overhead resistance from
some of these uh from this period in
June and from this area in May. Um,
additionally, right above that, we have
the 20-day moving average. So, there's a
lot of work here that needs to be done
for the NASDAQ to break out.
Additionally, you can see a symmetrical
triangle pattern formed and we clearly
broke down from that. And that would
also suggest maybe we come down towards
this 26,950
area. When we look at the S&P 500, it's
a little bit of a different picture.
We've been getting some consolidation
sideways as opposed to a move lower like
the NASDAQ. We have seen these types of
divergences before and it's mostly
because the NASDAQ is more technology
weighted and the S&P obviously even
though it's very heavily technology
weighted does have other components in
other parts of the market in it. But
right now you can see that the um 10day
exponential moving average again acting
as resistance. Lower Ballinger band
acting as support. clearly not nearly as
oversold at this point on the RSI as you
are in the NASDAQ. So, right now, uh I
think it's a very tough call. I mean,
you need to see the NAS the S&P really
break the 7350 area, 7,300 even call it
to really see further downside develop.
Until that happens, I think you just
have to work with the potential trading
range we're in, which is basically
between 7350 and maybe the upper end of
the range around 7560 or so. Uh, and
until one of those ranges break, it
looks like we're just going to continue
to pingpong back and forth. Finally,
look at the Dow. You can see very
clearly a different picture. Again, not
nearly as uh technology weight heavy. Uh
and so you have seen the Dow actually do
much better during this period of time.
Um in fact, you can make a case that the
Dow even broke out of its recent
downtrend. And whether or not there's
enough here to push it higher, hard to
say at this point. You can clearly see
Ballinger B um uh moving averages all
cleared. We have to again see one or two
days or three days of a sustained move
above those moving averages. We also
obviously see that the that the
Ballinger band has kind of flatlined
around the 53,120
area. We also can see that there is some
uh resistance from the prior highs in
early July at that area. So again,
that's kind of the region where if you
can see us break above the 53
120 to 53
150 area, there's a chance that we have
much further to go to the upside. If
that continues to be a area of
resistance, then it looks like for now
the downside is fairly limited at around
51,700.
But clearly, if that was to break, that
would open the door to something steeper
because you can see that this area has
held on a couple of prior occasions. And
a break of this region probably results
in us moving back towards 50,500,
maybe even below 50,000 at 49700.
Anyway, I hope you have a great rest of
your week and we'll see you next.