Video summary
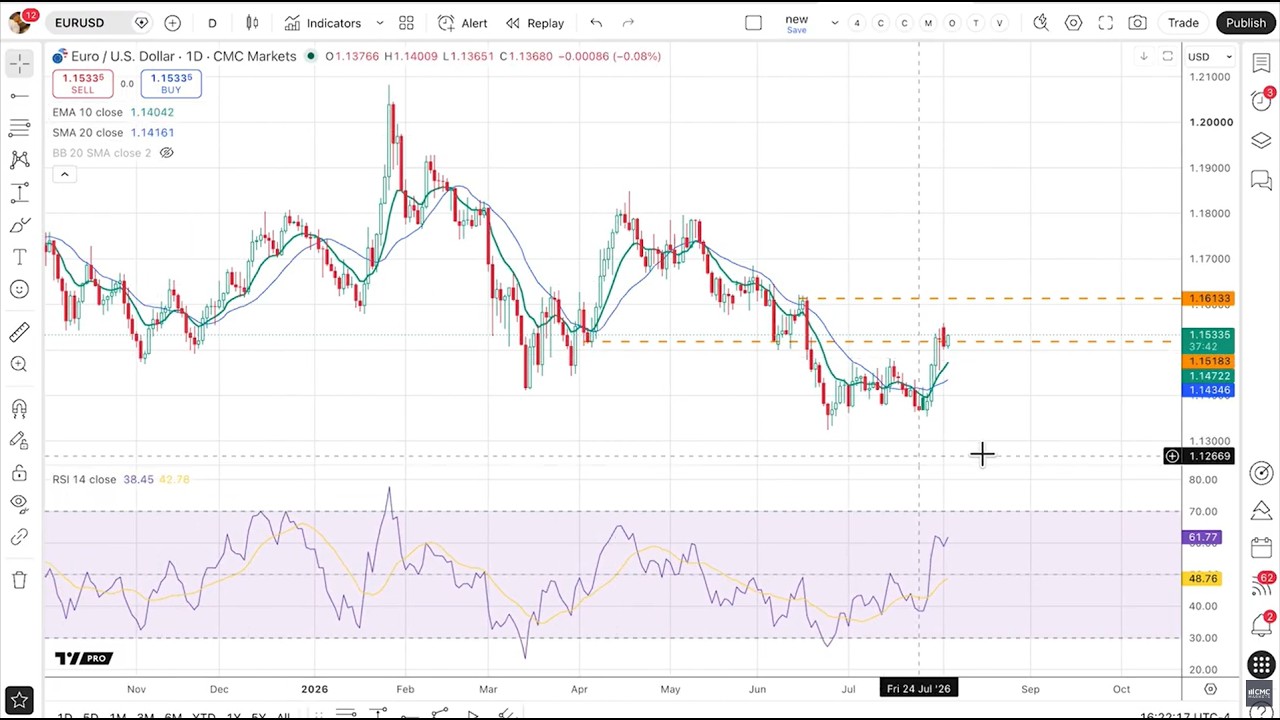
The video begins with an overview of a busy economic calendar scheduled for the rest of the week, highlighting key data points such as ADP employment, the ISM services index, unit labor costs, and the crucial non-farm payroll report expected on Friday. The speaker notes that this influx of data is particularly significant given the Federal Reserve's reduced guidance, creating uncertainty in market direction. Specifically for the Euro, it has rebounded over recent days but remains hovering near resistance around 1.15 after moving above key moving averages and extending beyond its upper Bollinger Band. A breakout higher could push prices toward 1.16 if economic data comes in weaker than expected, whereas stronger data might cause yields to rise and drag the Euro back down towards support at 1.135.
Turning attention to other major currencies and commodities, the British pound is described as being in a consolidation phase near resistance around 1.35, with potential moves toward either 1.3620 on an upside breakout or 1.3280 if it breaks down. The Japanese Yen has strengthened significantly following joint intervention efforts by Japan and the US but remains supported at the critical level of 155; a break below this threshold is seen as necessary for further strengthening, which analysts predict will likely happen given current monetary policy pressures in Japan. Meanwhile, Brent oil prices have retreated after a sharp rally, retracing nearly 62% of their recent gains and trading within a volatile range where headlines currently drive price action more than fundamental supply shortages; the key support level at $82 is viewed as decisive for determining whether prices will fall to $71 or eventually reclaim levels near $100.
In the realm of precious metals, gold continues to consolidate sideways in a triangular pattern while its Relative Strength Index (RSI) begins to turn higher, suggesting potential upward momentum despite declining volatility which often precedes lower price moves; however, rising volatility would be interpreted as a positive sign for future gains. The European DAX index is noted for having moved above prior highs and entering overbought territory after oil prices dropped, likely leading to short-term consolidation or a pullback towards its 10-day moving average before any further extension. Similarly, the UK's Footsie remains trapped inside its upper Bollinger Band with support holding near mid-February highs at around 10,900, setting up a potential breakout toward 11,430 if that level holds, or a decline to 10,460 otherwise.
Finally, the analysis covers major US indices where the NASDAQ has surged nearly nine percentage points but faces strong resistance near 29,700 after struggling to breach it since July; breaking this barrier could open the path toward another important resistance zone at 30,200. In contrast, both the S&P 500 and the Dow Jones Industrial Average have reached new all-time highs with less severe pullbacks than the tech-heavy NASDAQ, though they are also showing signs of overbought conditions that may result in sideways movement or minor corrections toward their respective moving averages. The speaker concludes by emphasizing that while these indices show strength, traders should remain vigilant for potential consolidation periods as markets digest recent rapid gains and await further clarity from upcoming economic releases.
Read the full video transcript
Hi everyone, it's Michael Kramer
Capital. Today is Tuesday, August 4th.
It's around 4:20 p.m. New York time. The
economic calendar for the rest of this
week will be rather full. We start to uh
on Wednesday, August 5th. We're looking
for ADP employment reading. Looking for
uh we're looking for July to show 70,000
jobs created down from 98,000 in the
month of June. Then at 10:00 a.m.
Eastern, we're looking for the ISM
services index, an increase to 54.5 from
54 in June. Then on Thursday, August 6,
we're looking for unit labor costs.
Those are expected to rise to 2.1% in
the second quarter from 1.8%. 8% then
productivity productivity we're looking
for it to rise to 0.6%
from 0.3%
and then of course on Friday August 7th
we'll be looking for the non-farm
payroll report 80,000 jobs were expected
to have been created in the month of
July up from 57,000
in June uh unemployment rate expected to
remain unchanged at 4.2% 2% uh average
hourly earnings expected to remain at
0.3% month overmonth and at 3.5%
year-over-year. Uh so the economic data
comes at a really important time for the
markets because we've been trying to
digest where everything is going now
that we have all these moving parts. We
have a Fed that's giving less guidance.
The euro has been able to rebound over
the last several trading days after that
initial drop in mid July. At this point
though, we're waiting for some form of
confirmation in terms of what the euro
is likely to do. You can see it's kind
of sitting right around resistance
around the 115 area with the next area
of resistance up at around 116. The euro
has managed to move back above the 10day
exponential and 20-day simple moving
averages while it's also right now a
little bit overextended beyond the upper
ballinger band. If we are able to
continue to move higher in the euro,
let's say the economic data were to come
in weaker than expected. The next area
of resistance probably comes somewhere
around 116. However, if economic data
were to come in stronger and we were to
see yields to rise, I would expect the
uh euro to weaken back down towards the
113 and a half area. When we look at the
British pound, it's not all that
different. We've seen it manage to
strengthen a little bit versus the
dollar, although it really hasn't again
moved anywhere beyond where it's been.
It's kind of sitting right now at
resistance around 135. You can see
slightly below the upper Ballinger band,
but also above above the 20-day and the
10day exponential moving averages.
Again, a breakout above the 135 region
sets up a return on the pound to around
13620,
while a breakdown would result in the
pound moving back towards 13280 or so.
We can also see that there's a little
bit of an uptrend that's formed on the
uh pound, while there's also a little
bit of a downtrend that's formed on the
pound. And so it looks like we're in a
little bit of a period of consolidation
here with a breakout potentially leading
towards probably a bigger move even
beyond the 13630 region. Over the last
week or so, we've seen some pretty
unprecedented moves in the yen with both
the uh with both Japan and the US join
joining forces to intervene in the FX
market. That's resulted in the yen weak
uh strengthening all the way back down
towards this 155 area. But notice the
155 area was really key in the last
round of intervention that eventually
led to the yen not really strengthening
any further and eventually rising back
towards 164. Uh and again in this
situation we haven't seen the yen break
below the 155 area. And I continue to
think that that's a critical area of
support for the yen. That as long as it
doesn't weaken uh strengthen below that
area, that you're likely to continue to
see the yen weakening. Unfortunately,
Japan has a physical situation and a
monetary policy situation that really
kind of allows for the yen to weaken
going forward. But if the governments
are really going to be forceful in
supporting the yen and defending it,
then, you know, they're going to have to
really push this below the 155 region
because that's the key area of support.
Until that happens on the uh on the yen,
I'm going to think it's probably going
to continue to weaken and probably rise
back towards the 160 region over time.
Brent oil after making a very big move
up has come all the way back down
falling by nearly 6% on Tuesday August
4th. Uh Brent Oil finds itself again in
a very volatile situation. Uh it had
made a really big move up and recovered
a lot of the losses it saw. But I think
it's also important to remember that the
uh Brent prices basically all they did
was retrace 61.8% 8% of the previous
move down and now we're looking at a
Brent move that's basically resulted in
a 61.8% retracement of the latest move
up. Uh and so again, if we're looking at
a scenario where the downtrend is lower,
we expect that Brent will break below
8230
uh will break below $82 and eventually
move back down to 71. If Brent's in an
uptrend, then we would expect this area
around $82 to hold and for it eventually
to surpass the $100 level. The big
question, of course, is which one will
happen. Brent's really been in a very
big area, a very big trading range over
the last several weeks. It seems like
the headlines are really just pushing it
around on a daily basis. uh whether or
not there's actually a real meaningful
supply of oil
shortfall in global markets, it doesn't
really seem to matter or not. Uh what
seems to be driving it is the ultimately
the headlines at this point. So until we
get back into some sort of situation
where the fundamentals become a little
bit more clear, I expect that volatility
is going to remain high and I think it's
at a very important spot right now again
after these 261.8% and 8% retracements
on the rally and on the decline. So
again, I think 82 is important on the
support area. A break below again, I
think sets up the move to 70 and if we
hold, then I think we go back to 100.
Gold prices continue to just consolidate
uh sideways. We're really not seeing any
movement there. The one thing that is
worth pointing out is that you have seen
the RSI begin to turn higher, which is
certainly a positive uh and could mean
that gold is getting ready to turn
higher. You can see it's just basically
consolidating in this triangle. the one.
But if we look at gold volatility, which
is also a really good indicator for
where gold may be heading, um we can see
that gold price uh gold volatility
hasn't uh been gold volatility has been
uh continuing to trend lower. And so
that I think is important because if
gold volatility continues to move lower,
then eventually I think price moves
lower. But if we do start seeing gold
volatility rising, then that would be a
positive sign and potentially lead to
higher gold prices. DAX has obviously
made a very big uh move over the last
couple of trading sessions after oil
prices have come down. We've seen it
take out the prior highs. Uh again,
we're looking at a situation where it's
getting into an overbought condition. Uh
the DAX has moved above the upper
Ballinger band for two days in a row.
We're just slightly off the 70 reading
on the RSI. What this tells us is that
we should probably expect to see the DAX
consolidate for a day or two, maybe
moving sideways, maybe we even see it
move back down towards the 10day
exponential moving average. It's
possible it continues it continues to
extend for another day or two. But
again, watching where this is versus the
Ballinger band and watching where it is
on the RSI tells us we should be
prepared in the next day or two for some
sort of either pullback or period of
sideways price movement. When we look at
the Footsie, it hasn't been able yet to
break out to the upside. You can see
that we're trading inside the upper
Ballinger band, but more importantly,
you can see that the 10day exponential
moving average continues to serve as an
area of support. We're right now kind of
also sitting at an area of support right
uh around the prior highs from
midFebruary.
This is continuing to be an important
area. If this is just a consolidation
phase and we do see uh the Footsie break
out above the one uh the 10,900 region,
then we could be looking at an extension
that ultimately takes it somewhere
towards uh 11,430
or so. If it if this area of support
doesn't hold, then I think there's a
chance we go all the way back to 10,460.
The NASDAQ 100 has had some pretty big
moves over the last couple of trading
sessions, rising by nearly 9 percentage,
rising by more than 9 percentage points.
This is an area I would call resistance
for the NASDAQ. You can see that this is
an area around 25 29,700
that we've been trying to breach now for
a couple of uh for really going back to
July and haven't been able to do. Uh so
I think that that's important. Also,
when we look at it right now, we still
do have room on the Ballinger band to go
higher and the RSI is only at a 57. So
if we are able to breach resistance
around 20,000 29,700
then I think there's room for the NASDAQ
to go back to 30,200 which would be
another area of important resistance. Uh
again the NASDAQ hasn't uh is in a much
different situation than the S&P and the
Dow. It did fall a lot more than those
two other indices as you'll see. Uh you
can see that the S&P has moved uh up to
an all-time high. It didn't have the
pullback that the NASDAQ had. Notice it
went below the lower Ballinger band and
then came right back up to above the
upper Ballinger band. Also notice that
we are uh seeing the 10day exponential
moving average starting to turn higher
as well, which could be supportive. Uh
right now we're not really in an extreme
overbought condition on the S&P with the
RSI around 66. So it could still go a
little bit higher. we may see again
another day of extension uh on the S&P
which could ultimately take it to around
7,800. But uh on the other side again we
are getting close to a period in time
where we would expect some sort of
consolidation sideways or maybe a pull
back down to the 10day exponential
moving average. When we look at the Dow
also above the upper Ballinger band had
a really big uh move the last couple of
trading sessions. Again, very similar to
the S&P and the DAX, kind of getting
into an overbought condition. Would
expect to see some sort of sideways
consolidation uh or a pull back down to
the 10 or 20-day moving averages just
based on where it is on the uh on given
the size of the move over the last
couple of days. Anyway, that's all we're
going to have uh for this week. We'll
see you.