Video summary
Michael Kramer from Mott Capital begins his midweek market update by outlining a busy schedule of economic data releases starting on Wednesday, August 26th, which could significantly influence currency markets. Key indicators include personal income for July, the PCE inflation measure, and GDP estimates, with specific expectations that headline PCE will rise slightly while year-over-year figures decelerate. The week culminates in Nvidia's earnings report after the New York close on Wednesday and Kevin Warsh's influential speech at the Jackson Hole Economic Symposium on Friday. These events are expected to drive volatility, particularly as traders assess whether inflation data supports a stronger dollar or allows for currency gains seen recently.
In the foreign exchange market, the Euro has been consolidating after a significant rise driven by news of potential US Treasury bond buybacks, though it remains vulnerable if PCE data comes in hotter than anticipated. While the pair has held above key support near 1.1660, a surprise inflation spike could reverse recent gains and push the currency back toward 1.1570. Similarly, the British Pound continues its strong upward momentum but shows signs of stalling after testing overbought levels; however, it remains susceptible to a pullback below 1.36 if economic data strengthens the dollar. The Japanese Yen is currently consolidating sideways with increasing volatility, attempting to build bullish momentum against a weakening dollar, with major resistance sitting near the 155 area and potential downside targets around 15720 if the greenback remains weak.
Beyond currencies, commodity and equity markets show mixed signals influenced by global supply themes and technical levels. Brent oil is in a retracement phase after a recent rally, currently trading between moving averages with bearish indicators like lower highs on the RSI suggesting potential further declines toward 82 if support breaks. Gold prices have accelerated upward following a weakening dollar, approaching resistance at 4750, but could surge past 4850 to test the 5,000 level if inflation fears subside. In European equities, the DAX has stabilized after falling below its uptrend and is now testing resistance near 26,600, while the FTSE approaches a critical zone around 11,000 that could open the door to significantly higher prices upon breakout.
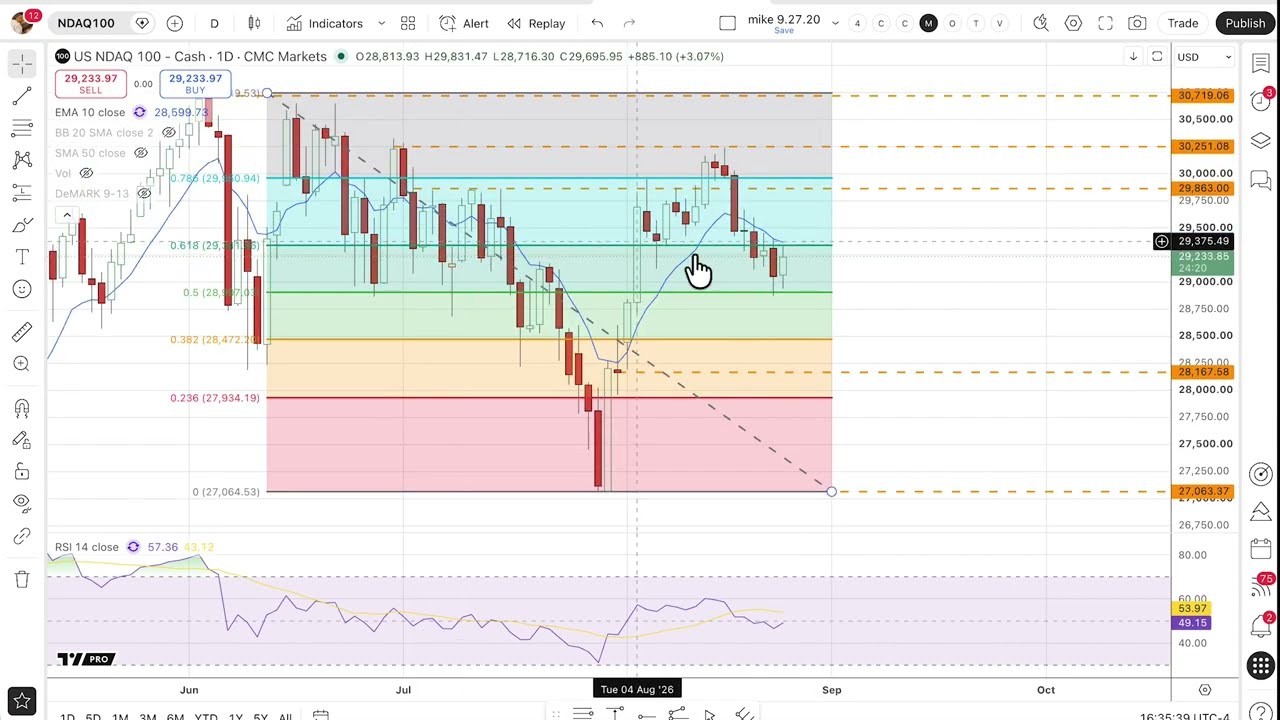
Finally, US stock indices are navigating a convergence of moving averages following a rough start to the week, with Nvidia's upcoming results poised to heavily influence direction. The NASDAQ and S&P 500 have recently dipped below their short-term moving averages, creating resistance that must be cleared for a sustained rally; a break above these levels could propel the NASDAQ back to recent highs near 30,100 and the S&P 500 toward 7800. Conversely, failure to hold current support levels could lead to deeper corrections, with the Dow Industrials showing similar consolidation patterns around its moving averages, where a break below 52,750 might trigger a decline toward 51,500. Overall, the market is balancing between potential upside from tech earnings and downside risks from unexpected inflation data that could strengthen the dollar and weigh on growth-sensitive assets.
Read the full video transcript
Hi there. This is Michael Kramer of Mott
Capital. Today is Tuesday, August 25th
and it's around 4:30 p.m. New York time.
So, it's been a quiet week up until now.
Wednesday, August 26th, we're going to
see a lot of economic data start to come
out. Then, of course, after the New York
close, we'll be getting Nvidia's
results. Uh Thursday, we'll take a
breather, but then on Friday, we'll also
have Kevin Warsh's big Jackson Hole
speech. So, when it comes to Wednesday,
August 26th, we're looking for personal
income for the month of uh July as along
with uh PCE. We're looking for uh PCE to
show uh a month-over-month gain of 0.2%
up from 0.1. Core PCE is expected to
remain unchanged at 3.3%.
Headline PCE month-over-month expected
to rise by 0.1% up from -0.1%.
Year-over-year expected to decelerate to
3.6%
from 3.7%.
Also, we'll be getting um
on the 26th, the second round of
estimates for GDP. We're looking for uh
GDP to remain unchanged at 1.5%.
Then, of course, on August 27th, which
is Thursday, we'll be getting our
initial jobless claims. And then, of
course, like I mentioned on and then on
Friday, uh August 28th, we'll have Kevin
Warsh uh giving his uh speech at the
Jackson Hole Economic Symposium uh at
10:00 a.m. Eastern time. That being
said, uh we have seen uh some movements
over the last week since we last spoke.
We did see a very big move in the euro
on Wednesday, August 19th. This was
following uh uh news that the Treasury
here in the US may look to increase its
bond buyback program. We did see the
euro rise into an overbought condition
where it saw the uh FX rate rise above
the upper Bollinger Band as well as the
relative strength increase above 70. Um
however, we have been consolidating
sideways now the last couple of days.
More importantly, we've also been
holding above support at this 116 60
area which coincides with the highs seen
at the end of May. So, as long as this
area of support continues to hold,
it does make a strong case for the uh
euro to begin to extend its gains
perhaps towards the 117 area, perhaps
all the way back up towards the 117
uh 90 region, 118.
If PCE were to come in hotter than
expected though on Wednesday, August
26th, that could result in the euro
giving back a lot of the gains we just
recently saw, potentially dropping
towards the 115 70 area, uh which also
would coincide with the 20-day uh simple
moving average, which comes in the
middle of the Bollinger Band. The
British pound uh also had a very big uh
sharp rise on Wednesday, August 19th. We
have seen it continue to grind hind
higher. Uh although it has stalled the
last couple of days, it did get to an
overbought position like the euro, but
not nearly uh in the same degree. You
can see it just barely uh got it barely
tested the upper Bollinger Band on two
occasions, and the RSI just barely got
above 70. Uh again, the pound appears to
be in a pretty strong upward momentum uh
trend right now. You can see the RSI
continuing to trend higher. Again, not
really in an overbought position. The
uptrend in the pound is also very
strong. You We can see that the uh
British pound's been uh rising right
along the 10-day exponential moving
average and uh we could see it extend
all the way up towards 137.
Like the euro, it is susceptible to a
pullback. If you were to get a higher
than expected PCE number, it could send
a decline in the pound below the 136
level. It could set up a return back to
the 19th levels around 1913530.
When we look at the Japanese yen, not
much happening here. We've really been
consolidating sideways now. Going back
to August 10th, you can see that right
now the yen is uh basically moving uh uh
beyond the 20-day moving average. The
50-day moving average is way up around
161, so there's plenty of room there.
You're seeing the volatility come back
in with the implied with the Bollinger
bands starting to compress. You can also
see that the yen is trying to make an
attempt uh to build some bullish
momentum, although we haven't quite
gotten there yet. Uh again, if we
continue to see the dollar weakening as
we've been seeing more recently in the
euro and the pound, it potentially sets
up uh more uh yen strength as well,
potentially coming down to 15820,
even maybe coming back down towards the
lower around 15720.
Uh the big level for the yen continues
to be the 155 area, which we're nowhere
near at this point. Uh if we were to see
again a a stronger PCE reading, I think
that could potentially propel the yen up
towards the 160 and 1/2 to 161 area,
which is where the um 50-day moving
average resides.
Uh Brent oil has remained fairly uh
volatile. It did make a very nice move
up, although it has stalled out uh at
this point. Um From where we were on
August 21st, we've seen it come in hard
the last 2 days. Again, uh one would
think with some of the broader themes
going on in the world with supplies uh
globally, we continue to see oil moving
up. Hard to say what makes it move on a
daily basis these days, but at least at
this point uh it would seem that maybe
we're just in a little bit of a
retracement phase. You can see that if
you measure from the bottom here uh on a
August 5th to the peak on August 21st,
we're just about in that 50% to 61%
retracement zone. Uh a break below 87
and 1/2 probably does set up though a uh
a a move back down towards the 50-day
moving average. Um notice that we did
break below the 10-day exponential and
the 20-day simple moving averages, which
is a little bit of a bearish short-term
indicator. Uh also, if you notice the
RSI has started to turn lower putting in
a lower high, which also could be an
indication that momentum is starting to
to wane and and starting to turn more
bearish. I would think if we were to see
the uh price of oil dip below the 50-day
moving average, that would be a real
negative over the near term and it would
probably mean that the oil price of oil
could test 82 and maybe even test some
of the lower levels we recently saw back
in early July when it reached into the
70s. I would think though again that
there's a lot enough things going in the
world that volatility in oil is probably
going to remain high and this may just
turn out to be a period of uh
retracement. Gold prices have uh
suddenly really started to move again.
This big move up on the 19th came on the
same day as we saw the dollar really
begin to weaken uh globally against the
major currencies and you're seeing it
also in the precious metals with gold
prices really uh accelerating now to the
upside. Uh gold finds itself not quite
overbought yet. Perhaps there's some
more room to reach towards 4750 or so.
Just like the FX rates, a stronger uh a
stronger PCE report which leads to more
confidence that the Fed is going to have
to hike sooner than later, likely acts
as a headwind for gold only because the
dollar should technically strengthen on
something like that. Um, and that should
lead to gold prices coming in.
Otherwise, the next area of resistance
for gold is around 4750,
and you can see that maybe up to 4850 is
another area of resistance. But, if you
were to get below beyond 4850, gold
could make a run towards the 5,000 to
5,100 area cuz there's just not a lot of
resistance to really get in the way of
it once we get past the 4850 region. The
DAX has ended up stabilizing after
falling below that uptrend. We haven't
really seen it uh extend any further. In
fact, we did see the DAX get back above
the 10-day exponential moving average
after trading below it for a couple of
days. This is probably more of the
positive development, which suggests
that maybe the DAX can rise back to the
trend line somewhere uh around 26,580
to 26,700
in this range would be the next area of
resistance. Uh a break below 26,000
would probably open a pathway to the
50-day moving average and the support
area from uh late July around 25,500.
But, right now the trends look fairly
favorable for the DAX if it can stay
above that 10-day moving average. The
FTSE has also managed to get back above
the 10-day exponential moving average,
which does make some sense since we have
seen the FTSE tend to do
better when precious metal prices are
rising. We can see that it is testing
this area of resistance around 10,800
to 10,875
to about 11,000. A breakout above 11,000
obviously opens the door to
significantly higher prices. While, if
we were to see the the FTSE really kind
of stall out around this 10,900 area
really unable to get through this zone
of resistance like it did the last time
we'd have to then beginning to watch the
movements versus the 10-day exponential
moving average cuz that would be our
first signal that perhaps the FTSE is
going to run out of steam and not be
able to have the momentum needed to
carry it higher. The NASDAQ has had a
rough start to the week falling on
Monday the 24th and then rebounding
slightly on Tuesday the 25th. Again,
Nvidia results on Wednesday the 27th are
likely going to have a heavy hand in
where in the NASDAQ goes from here.
Notice that the NASDAQ got above the
20-day
got above the 50-day moving average and
has now come back below it. It's also
come back below the the 10-day
exponential moving average. It's also
trading right around the 20-day simple
moving average. So, we're right now at a
convergence of moving averages which
appear to be serving as an area of
resistance at least for right now.
Again, if the if the if the if the index
can get above those moving averages,
those moving averages then could become
to could could begin to work as support,
but right now we're below them and you
can also see that momentum is starting
to really wane.
If we were to see the NASDAQ drop below
28,900
which is sort of the low we saw on the
24th, I think that probably opens a
pathway to lower levels maybe even
an area in this open area in here which
looks like a gap back to around 28,160.
If we're able to get above those moving
averages again, I think you could see
the NASDAQ probably retest the recent
highs around 30,100.
The S&P 500 also has just recently moved
back below the 10-day exponential moving
average. You can see it's been serving
as resistance for the past couple of
days a very similar look to what the DAX
looked like.
So again, I think it's a very similar
sort of motion. Uh if you were to get
really positive numbers out of Nvidia
and you were to see uh the the S&P rise
above the 10-day and potentially get
beyond 7710,
that probably leaves the S&P moving back
up to 7800 pretty quickly.
Uh on the flip side, if we were to see
the S&P break the 7650 area, I think
you're potentially talking about it
going all the way back to 7575,
but more importantly, uh perhaps all the
way back to 7450 or so. Maybe it makes a
stop at the at the 50-day moving average
first, but you can clearly see there's
an opening in this chart, which suggests
there's a gap there that may still be
waiting to get filled. Uh finally, when
we take a look at the Dow, you can see
also kind of converging around its
moving averages. The 20-day moving
average, the 10-day has been kind of
weaving back and forth above and below
it. You can see right now that the
10-day is sort of acting more as a
magnet as opposed to support and
resistance. You can just see that we've
been kind of meandering around it since
the 17th. Uh again, I think it's a very
similar type of setup with the Dow. Now,
Nvidia doesn't have nearly Nvidia is in
the Dow Industrials, but it doesn't have
the same type of weighting that it has
in the Dow as it does compared to the
S&P and the Nasdaq. So, positive results
out of Nvidia may not have a very big
impact on the Dow, but clearly the
upside resistance level somewhere around
54,400,
while a break of support at 52,750
and probably the 50-day moving average
at 52,700,
probably leads to a steeper decline back
towards the 51,500
region. Anyway, that's all I'm going to
have for this week, and we'll see you
next.