Video summary
Michael Kramer from Mott Capital outlines a critical economic week beginning on Wednesday with the release of US CPI data, which is expected to show headline inflation rising by 0.1% month-over-month while core CPI increases by 0.2%. Following this, Thursday will bring PPI numbers that help gauge future PCE trends preferred by the Federal Reserve under new leadership, and Friday features retail sales figures for July. The speaker emphasizes that these data points could significantly influence foreign exchange markets; specifically, a hotter-than-expected inflation report is likely to strengthen the US dollar against major currencies like the euro, British pound, and Japanese yen, whereas cooler numbers might weaken it further by reducing expectations of future interest rate hikes.
In terms of specific currency pairs, the Euro remains near its 78.6% retracement level but could climb toward 116.10 or even 116.70 if it breaks above 115.5 with follow-through momentum. The British Pound is currently trending higher around the 135 area and needs to clear resistance at 135.40; a strong CPI report could push the dollar up, causing the pound to fall back toward 132.80 or even lower, while weak inflation data would likely propel it above 136 towards 137. Similarly, the Japanese Yen has retraced some of its decline following intervention efforts and might weaken further toward 160 if conditions allow, but a cooler CPI report could see it drop back down to test support levels around 155 or even 157 established during previous interventions in April.
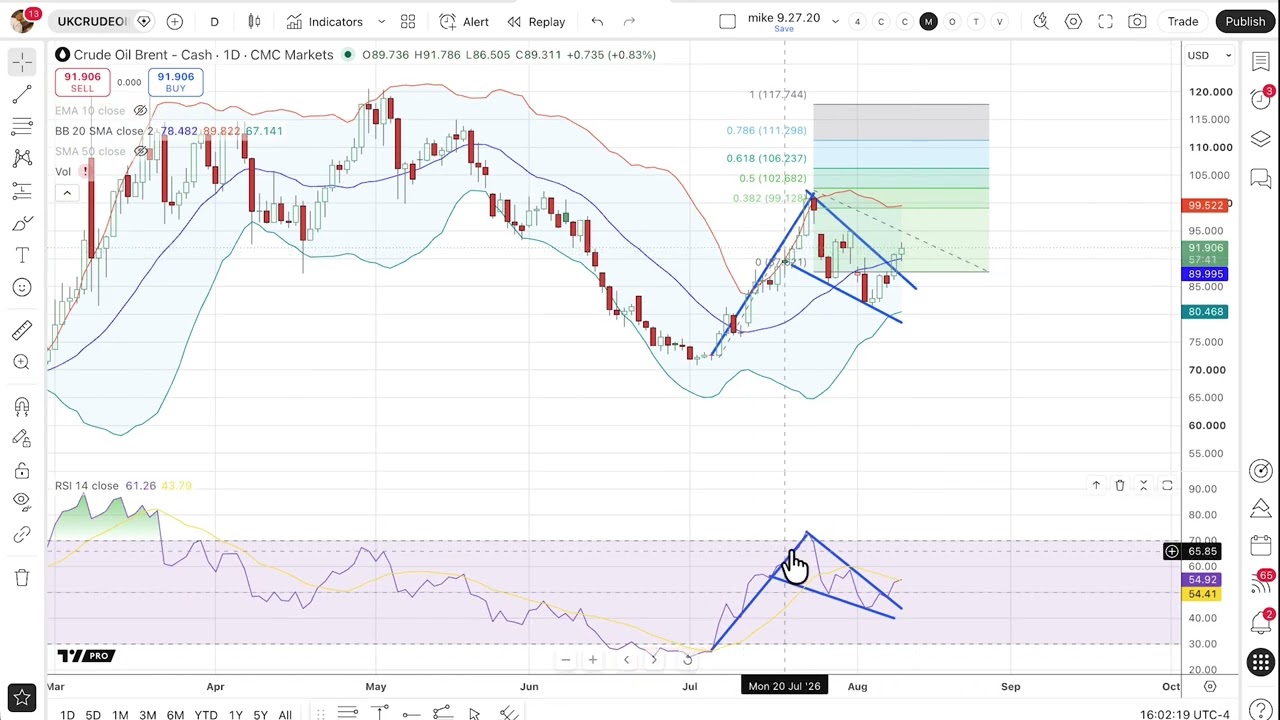
Beyond currencies, commodity prices show mixed signals with oil forming a bull flag pattern after breaking through key moving averages and resistance near 99.60, potentially heading toward 120 if the trend holds above its support at $82 per barrel. Gold has extended beyond its upper Bollinger Band for several days but may enter a consolidation phase around the 4500 area before continuing higher or diverging in volatility. Meanwhile, European and US equity indices display signs of overbought conditions; the DAX is consolidating after new highs with potential targets near 26,800 unless oil prices surge aggressively, while the FTSE has broken below its short-term moving average support at 10-day levels and could decline toward 10,430 if downward momentum persists.
Finally, major US stock indices like the NASDAQ 100, S&P 500, and Dow Jones are all approaching significant resistance zones after recent sharp gains. The NASDAQ is testing a key barrier around 29,870 with potential for new all-time highs above 30,300 if it holds its current support near the moving averages, while failing could see a retreat to lows around 27,030. The S&P 500 has room to extend toward 7825 provided positive news supports sentiment, otherwise facing support at 7650 or lower levels. Similarly, the Dow Jones remains in an uptrend above its key moving average but faces resistance near 54,550 according to Bollinger Bands, indicating that while these markets are strong, they remain sensitive to upcoming economic data and potential trend reversals if technical supports break down.
Read the full video transcript
Hi there. This is Michael Kramer of Mott
Capital. Today is Tuesday, August 11th.
It's around 4:00 p.m. New York time. So,
Wednesday, August 12th will be the big
inflation day. We'll be getting the CPI
report here in the US.
Core CPI is expected to rise by 0.2%
month-over-month, up from a reading of
0.0% in June. Core CPI year-over-year
expected to rise by 2.5%
down from 2.6%. Headline CPI expected to
rise by 0.1% month-over-month, up from a
negative 0.4% in June. Year-over-year
headline CPI expected to rise 3.4%
down from 3.5% in June. Uh then, of
course, on Thursday, uh August 13th,
we'll be getting the uh PPI numbers,
which the market cares a great deal
about because when you take certain
parts of the PPI and you combine it with
the CPI, you get a really good
read-through into what the PCE is likely
to be at the end of the month. And
historically, PCE has been the Fed's
preferred metric of inflation. Although
with Kevin Warsh now as the head of the
chair of the chair of the Fed, uh
there's been some discussion of of
looking at other measures as well. We'll
have to see what his committees come
back with on on those decisions. Uh PPI,
we're looking for year-over-year final
demand to rise by 4.9%
down from last month's reading of 5.5.
Month-over-month, we're looking for it
to increase by 0.2% up from -0.3.
And then on Friday, August 14th, we'll
be looking at retail sales
month-over-month for July. We're
expecting a gain of 0.1%
down from 0.2. Ex autos, were looking
for a gain of 0.2% up from a negative
0.2. And the retail control group
expected to rise by 0.3% down from 0.5.
So, this will be a very heavy, uh, busy
week of economic data from today, uh,
from Wednesday into Friday. And that
could have a really big impact on
different parts of the market and things
of FX, for example. So, the euro hasn't
has not moved since last week's update.
You can see we continue to sit at the
78.6%
retracement level.
Uh, and I think it's fairly simple at
this point. If we see the euro break
above 115 and a half and actually see
follow through the next day, uh, I think
there's a good chance you'll start
seeing the euro creep up towards this
116.10 area and potentially all the way
back to the 116.70
area. If this area of resistance here
proves to be too much, you get a hot CPI
report,
market starts pricing in more Fed rate
hikes, then I think you're going to see
the euro probably come all the way back
down
to 113.50 at least initially and it
could even have further to go than that.
When we look at the British pound, it's
also basically been trending a little
bit higher here. You can see right
around the 135 area. The level it needs
to clear is this 135.40 area. Again, I
think it's fairly straightforward. Hot
[snorts] CPI, uh, comes out, uh, I think
you're going to see the dollar
strengthen against just about every
currency pair out there, probably
[snorts] resulting in the, uh, British
pound falling to around 130 134.30,
probably going all the way back to
132.80.
A weak CPI report, one that comes in
cool, I think probably leads to the
pound rising above 135.40, probably
going all the way back to 136, maybe on
the way to 137 because I think, uh, a
weak, uh, CPI report probably takes rate
hikes off the table
anytime probably in the foreseeable
future unless something really begins to
change in the inflation narrative moving
forward. When we look at the Japanese
yen, you can see that we had the big
intervention. We have retraced some of
the
some of the move that we've seen
following the intervention. You could
see if you measured all the way down to
the intraday lows, we're just about a
50% retracement, but if we were to
measure from the the closing area, you
can see we haven't even had a one a
38.2% retracement yet. So, it's possible
you could continue to see the yen weaken
a little bit further, maybe head back
towards 160. However, [snorts] again,
with the CPI report, hard to say. I
think you get a cooler number, like I
said about the other two, there's
probably a good chance that the yen is
going to probably start moving back down
towards 157, testing this area from the
intervention date, maybe even eventually
testing the 155 region, which proved to
be a very critical level of support back
during the last round of intervention
that took place on April 30th. When we
look at Brent, we can see that there's
what I have drawn in here is a bull
flag. We are starting to see oil prices
really begin to move up again. They did
appear to break out of that bull flag,
and it looks like maybe there's room for
it to continue to rise. Here's your
10-day exponential moving average, which
also was acting as a level of
resistance. We obviously broke through
that. [snorts] When we look at the
Bollinger Band, we also saw that the
price of oil has broken through the
20-day moving average. The next area of
resistance for Brent is probably
somewhere around 99.60,
but there's a good chance if you were if
this is a true, you know, bull pennant
bull flag type pattern, that you're not
only going to go back towards the upper
end of the Bollinger Band, but there's a
good chance you're probably going to be
heading up towards around 117 to 120.
Very similar pattern on the RSI and you
can see RSI is gaining momentum to the
upside as well, suggesting there's
further room to go. I think obviously a
piece of news could obviously change
this very easily,
>> [snorts]
>> but I think the big level of support
remains around this $82 a barrel area,
which was the recent lows. If we see the
oil prices drop below 82, it probably
opens the door to lower prices still.
Look at gold prices. Here was the Here
was the breakout that we had last week
back on August 5th. You can see gold had
that big move up. We've actually now
extended beyond the upper Bollinger Band
for about 5 days in a row.
Today,
at least here on August 11th, we've seen
gold come back in. There's possible here
that we're looking for gold to
potentially put in some form of
consolidation period after this big run.
I will note that if you look at the
technical chart, you can see there was a
bit of an area of consolidation
on the chart prior to the breakdown
right around this 4450
4500 area. So, if you are likely to see
gold maybe stall out, this seems like a
reasonable area for that to happen. The
other thing I continue to watch
obviously is the volatility of gold and
for the most part it's starting to trend
higher as well. Although you have
started to see it come down pretty hard
on the 11th, so I think this continues
to be a very key gauge in trying to
determine if the gold's [snorts] move is
real, especially if you start seeing the
two
diverge because this has been the way
that gold has been working now for some
time. When we look at the DAX, you can
see the DAX has moved up really sharply.
The last couple of trading sessions were
at you know, new new highs here on the
DAX, which is a little surprising given
that you've seen oil prices really begin
to move higher. When you at least look
at the DAX, you can see it's
consolidated now for a few days after
breaching the upper band getting into
overbought territory. It leaves room for
the DAX potentially continue to push
higher, maybe to around 26,750,
26,800.
That would be the next area of
resistance I would be thinking based on
Bollinger Bands. Obviously,
uh a big move down below the 26,120
level could lead to a test of the 20-day
moving average. But right now, as long
as you stay above the 20-day moving
average and even the 10-day exponential
moving average,
the trend in the DAX continues to work
higher. Uh again, if oil prices start
rising more aggressively, that could
certainly change things. We look at the
FTSE, we can see that the FTSE also got
overextended and it's been starting to
consolidate sideways a little bit.
Although it's starting to show some
signs of breaking down. In fact, on
August 11th, you can see we closed below
the 10-day exponential moving average,
something that had been acting as
support. So now with that level broken,
it could mean that we're going to see uh
the FTSE fall back towards 10,750.
Also, we [snorts] can see that momentum
is beginning to roll over as well for
the FTSE. So that's something to keep an
eye on as we go forward. Uh this area
that had been the highest prior and back
in February have has clearly held as
resistance for now. And so there's a
possibility here that if we do start
getting some momentum to the downside,
we really can't rule out a return to
around 10,430
or so. The NASDAQ 100, we can see in the
US has risen right to resistance around
29,850.
This seems like a fairly important area
for it. Here's our 10-day exponential
moving average, what had been
uh resistance has now become somewhat of
support. So we're continuing to watch
this area here to see if we can hold
that. If we can hold it, then I think it
probably means that we're going to
retest and continue testing the 29,870
area. A breakout probably means that
we're going to start seeing uh the
Nasdaq advance towards 30,300,
which is an area also of resistance from
a Bollinger Band and prior highs. I
think ultimately, if those levels start
to clear, then we're talking about new
all-time highs. If the Nasdaq falls
below one of these moving averages, then
I think there's a good chance you see it
just return to the lows at around
27,030.
Well, look at the S&P, that also has
seen a a fairly big move up, similar to
almost what we've seen in the DAX, and
you can see the 10-day exponential
moving average uh much lower here around
67650.
So, there's some good support and some
room for the S&P to fall before getting
back to support. We also did get above
the upper upper Bollinger Band. So,
right now it looks like there's room to
extend to around 78 um 7825 or so.
That's if we can get some news that's
positive enough to lift the market.
Maybe you get a a weak CPI report and
stock market responds positively to it.
Otherwise, I think, you know, support
probably is at 7650,
and then we're talking about 75 uh 75 or
so. So, there's some good support
underneath the S&P at this point that
you really need to see uh you would need
to see the market really start giving
back some of these gains, and at least
as of right now, we haven't seen that
yet. Uh the Dow also got into overbought
territory, rising above the upper
Bollinger Band. Right now, still above
the 10-day exponential moving average. I
think that continues to be the key to
all these markets. If you start seeing
[snorts] that break, probably an
indication of trend changes, uh but for
right now, the Dow is in a little bit of
an uptrend here. It has support
underneath it. Upper Bollinger Band
suggests we could see it return to
around 54,550
or so, which would be the next area of
resistance. Anyway, that's all we're
going to have for this week and we'll
see you next. Bye.