Video summary
This week's trading landscape is heavily influenced by a series of significant economic data releases scheduled from Wednesday through Friday, which will play a crucial role in shaping Federal Reserve policy expectations. Traders are anticipating the ADP National Employment report on Wednesday, followed by the ISM Services report on Thursday and the pivotal nonfarm payroll report on Friday, where a strong jobs creation figure could push for an immediate rate hike in September, while weaker data might delay such moves. Currently, markets are pricing in a stronger dollar, evidenced by the weakening euro despite rising odds of an ECB rate hike, suggesting that the market increasingly believes a Fed rate increase is imminent before the year ends.
In the currency markets, both the British pound and the Japanese yen have been weakening against the strengthening dollar, with technical indicators pointing to further downside risks if economic data meets expectations. The GBP/USD pair has fallen below key moving averages and support levels around 1.3550, potentially opening the door for a decline toward 1.3440 or even 1.3030 if the 1.35 area breaks; conversely, it would require surprisingly weak data to push the pound higher, facing strong resistance near 1.3625. Similarly, the yen has moved above its 10-day moving average but faces resistance around 161.60 to 162.00, with a potential return to intervention levels near 163.80 if the dollar continues to strengthen against other major currencies.
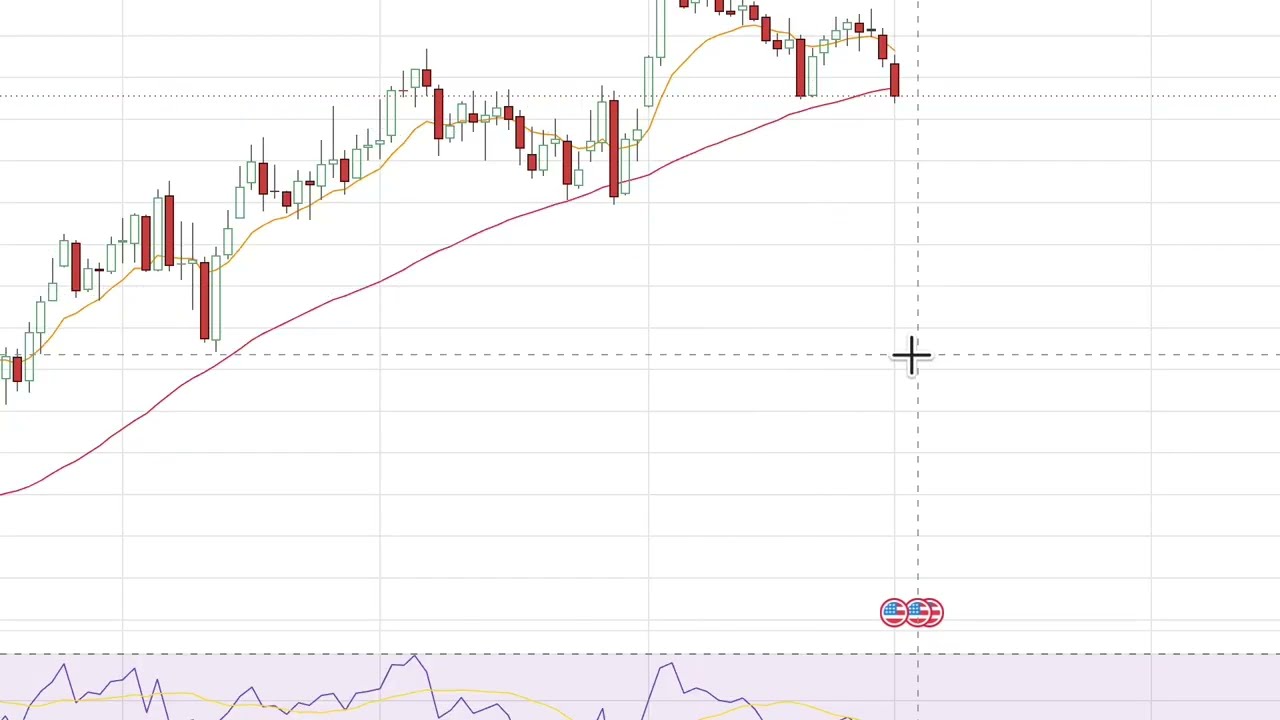
Beyond forex, commodity and equity markets are showing signs of volatility driven by rising oil prices and a strengthening dollar, which acts as a primary headwind for gold and risk assets. Brent oil has broken out of a consolidation phase with potential targets near 102, while gold prices have declined alongside the dollar, with a breakdown below $43.25 signaling a drop back toward $4,000. In equities, major indices like the DAX, FTSE, NASDAQ 100, S&P 500, and Dow Jones Industrial Average are all grappling with downward pressure; the DAX has broken below key support levels after testing resistance, the FTSE is finding support at 10,700 but risks a drop to 10,425 if that level fails, and the NASDAQ 100 is hovering near a critical retracement area with a break below 29,000 potentially erasing recent gains. Overall, the combination of surging oil prices, rising global interest rates, and a robust dollar suggests a risk-off sentiment may be taking hold globally, posing significant challenges for most equity markets.
Read the full video transcript
Hi there, this is Michael Kramer of Mott
Capital. Today is Tuesday, September
1st, and it's around 4:15 p.m. New York
time. On Wednesday, September 2nd, we'll
be getting ADP National Employment.
We're looking for 48,000 jobs to have
been created in the month of August, up
from 44,000
in July. Then on Thursday, September
3rd, we're looking for ISM Services
report to come in and show a reading of
54.2
versus last month's reading of 54.1.
And then on Friday, September 4th, we'll
be looking for nonfarm payroll report.
56,000 jobs expected to have been
created versus a decline of 23,000 in
July.
Unemployment rate expected to remain
unchanged at 4.1%. Average earnings
expected to rise by 0.3%
month-over-month from 0.1% while
year-over-year is expected to decline to
3.0% from 3.2%.
Uh the economic data this week's going
to have a huge say in what the Fed is
likely to do at the September meeting.
Anything that comes in line probably
leaves the market convinced that a Fed
rate hike before the year is over is
likely coming. While if we were to get
hotter data, I think it uh probably
means uh a rate hike as soon as
September. While a miss on the data
certainly could at least buy us buy the
Fed some more time to look at the data
that comes in in the months ahead,
potentially delaying a rate hike. But
for right now, the market's been really
pricing in stronger dollar, which is
really a sign that the market is
increasingly starting to think a Fed
rate hike is coming because the euro is
weakening versus the dollar despite you
know, the odds of a rate hike from the
ECB in September increasing. So, what
we've seen currently is the the uh
versus the dollar fall below the 10-day
exponential moving average around 116.
We're currently below a support level
also around 116.
This sets up a possible return to around
115 and a quarter, which would be a next
area of support for the euro, which also
coincides roughly with the 50-day moving
average, which resides around 115. Uh
really though, a break up below this
area of support, the support region
between 115 and 115 and a quarter really
opens the door for the euro to return to
around 113 and a half, which has been
the lower end of the range now uh going
back to June and July. The pound has
also been weakening versus the dollar,
moving back below the 10-day exponential
moving average, moving below support at
the 135 and a half area.
Uh it looks like at this point data that
comes in as expected probably enough to
continue to weaken the pound versus the
dollar, potentially pushing it down
towards the 13440 area, which also
coincides with the 50-day moving
average. Uh anything below that area of
support potentially sets up a decline
back towards 130
three. It's going to take pretty weak
data, I think, to get the pound to
really strengthen versus the dollar, and
if it does, it has some pretty strong
resistance in this 136 to 136 and a half
area, which has been a region it hasn't
really been able to get through since uh
early May. The yen has been weakening
versus the dollar as well. We can see
that the yen is now decisively moved
above the 10-day exponential moving
average, has been consolidating just
below the 16040 region. There is a
50-day moving average hanging around the
161 area. All likelihood, if the dollar
is going to continue to strengthen
versus the pound and the euro, there's a
good chance it's going to probably
continue to strengthen versus the yen,
which I think thinks sets up a return to
the 161
uh 60 to 162 area of resistance with the
potential even to return all the way
back to the intervention range around
16380.
Uh meanwhile, if we were to see you
again weaker data, we need to break
through support around 159.
Uh that's been a really tough area, and
it looks like downside is only to around
158 at this point. Maybe 157 and a
quarter, which has been the low end of
the range since intervention. Otherwise,
the yen's been pretty contained. Uh
Brent oil has now appeared to break out
of a consolidation phase. It looks like
a fairly clean breakout as well, moving
above the 10-day. You could see the
50-day moving average actually beginning
to turn higher here. The only thing we
have to think about again is here's your
upper Bollinger band. RSI's those only
around only around 61, which suggests we
really could continue to see oil prices
rise from here. The question, of course,
is what kind of breakout is this and
what kind of formation is it breaking
out from? Because if this is some sort
of consolidation pennant type pattern,
we could be looking at a price of Brent
going back to around 116 or so. Uh
certainly, the breakout on September 1st
looks pretty powerful, uh and it could
see some follow-through with the next
area of resistance around 102. Uh gold
prices have also been in decline uh as
the dollar has uh strengthened. Uh the
dollar continues to strengthen, gold
probably continues to decline along with
rising rates won't be good for gold. Uh
a breakdown below 43 and a quarter
probably sets up a drop back towards
around 4,000 on gold prices. That may
come as a surprise to some, but uh but
again, the dollar has really been the
driving force here for gold. All you
have to do is type in the DXY, and you
can see that it's basically been an
inverse trade now for some time, and uh
that's likely to continue. So, the
dollar strengthening here is the gold's
biggest challenge. Uh we've seen the DAX
really get hit the last 2 days. What we
did notice last week was that this
uptrend was broken. We looked like we
were coming back around. We did test
that area of uh resistance. We're now
back below the 10-day exponential moving
average. It looks like we've also broken
what could be the neckline of a double
top pattern that's maybe formed in here.
Again, something to watch. If we do see
that if this is a the breaking of a
neckline, it probably means that the DAX
finds support around 25,540,
um
which also is near the 50-day moving
average. But really, there's a chance
here that the DAX could move all the way
back down into this 24,750
region if this area of support breaks.
If today um if the move on September 1st
uh is just a fake out, and we manage to
hold support at this neckline area
around 25,900,
then we could see a pretty meaningful
rebound back towards the highs. But
right now, with oil prices surging and
the potential to surge further, uh the
DAX may start to feel some of the
pressure. Uh the FTSE's also struggled
more recently now that commodity prices
are starting to come down with gold and
silver. Uh more recently though, we've
seen the FTSE
fall below the 10-day exponential moving
average, but it's finding support at the
50-day moving average, while also
finding support at 10,700, which is
marked highs and resistance now uh on a
couple of different occasions. If we see
the FTSE break below the 10,700 area, I
think it opens a pathway back towards
10,425.
If this area of support holds, which may
be challenging if gold prices continue
to decay, uh if this holds, then I think
there's a chance we rebound back to
10,875.
But again, those odds seem to be The
NASDAQ 100 has uh had fallen on
September 1st by around 1 and a quarter
percent. You can see that we got just
about to the 78.6% retracement area on
the NASDAQ just maybe barely above it
which could signal that the rally that
we saw on the NASDAQ may have now run
its course.
We are seeing here that there's an area
of support around 29,070
which marks the low area that we saw
back on August 24th.
We're also now consolidating and hitting
up against the 50-day moving average. A
break below 29,000 probably sets up a
decline all the way back to 28,150
maybe all the way back to 27,000 which
would erase that little rally that we
had following some mega cap earnings.
If for some reason we're able to
maintain this support region around
29,000
then I guess we can always go back
towards the highs around 30,140.
But with the dollar strengthening,
interest rates surging globally and oil
prices moving higher, it looks like risk
off may be starting to take over
globally and probably going to be a
major headwind to most equity
most risk assets. We saw the S&P fall by
about 70 basis points on September 1st.
Right now it's wedged in between the
10-day exponential moving average which
it broke below and the 50-day moving
average below it which would be the next
area of support. Also coincides with
7575
which is an area of resistance and
support that formed back in June.
A break below 7575 probably sets up a
return to as low as 7300 over time.
There is also a decent amount of support
built up in the 7485 to 7500 region. You
can see that right here with this area
potentially serving as a gap fill.
Otherwise, if we manage to hold on to
support at 7575, I think we'll probably
see the highs retested again at 7800.
We can see that the
that the Dow Jones Industrial today
closed below the 50-day moving average.
That's really the first time we've
closed below it now since the end of
July. You can see at the end of the July
when we did close below it for the day,
we didn't really close below it for more
than that day. We managed to bounce back
quickly. So, we're going to want to
watch to see if the Dow is able to
bounce back quickly. If it does, perhaps
it signals that maybe the sell-off in
the Dow will be short-lived. If we were
to see the
the Dow continue to extend losses, the
next area of support probably comes
somewhere around 51,615.
That's all we're going to have for this
week. Until next time, have a good one.