Video summary
Michael Kramer from Mott Capital begins his midweek market update by noting that while the current trading session is relatively quiet, Wednesday will be the busiest day due to the release of Federal Reserve minutes at 2:00 p.m. Eastern time. The rest of the week features lighter economic data, including jobless claims and leading indicators on Thursday, followed by the S&P Global Flash PMI readings on Friday that will offer early insights into manufacturing and services sectors as well as underlying inflation pressures. In the currency markets, the euro has shown limited movement but has successfully moved beyond the 78% retracement level, suggesting a completed corrective pattern after refilling the drop seen in mid-June; however, for a sustained rally, it must break above the 200-day moving average to avoid potential reversal risks. Similarly, the British pound is facing resistance around 135.50, with bullish momentum supported by rising RSI and room within the upper Bollinger bands, though a failure to clear this zone could lead to a decline back toward the 200-day moving average near 134.40.
The Japanese yen remains in a consolidation phase after stalling around the 50% retracement level, with the market currently deciding its next direction while staying above the critical 10-day exponential moving average and the 159 support level. Analysts suggest that as long as the yen holds above 159, it may continue to weaken against the dollar, but a sustained break below the 200-day moving average could trigger a drop toward 157 or even the key psychological level of 155. Brent crude oil is still operating within a bullish pennant flag pattern that formed after a recent breakout, with momentum building favorably and plenty of room to rise toward $100 per barrel according to Bollinger Bands; however, a decisive break below the moving averages and specifically under the recent low of $88.50 would signal a pattern failure and a potential decline back to the $81 to $82 range. Gold has become slightly overextended and is now retreating inside its Bollinger Bands, finding support at the 10-day exponential moving average and the $4,320 level, with resistance sitting at $4,450; breaking above this resistance could open a path toward $4,600, while dropping below the 10-day average might lead to a revisit of the $4,000 mark.
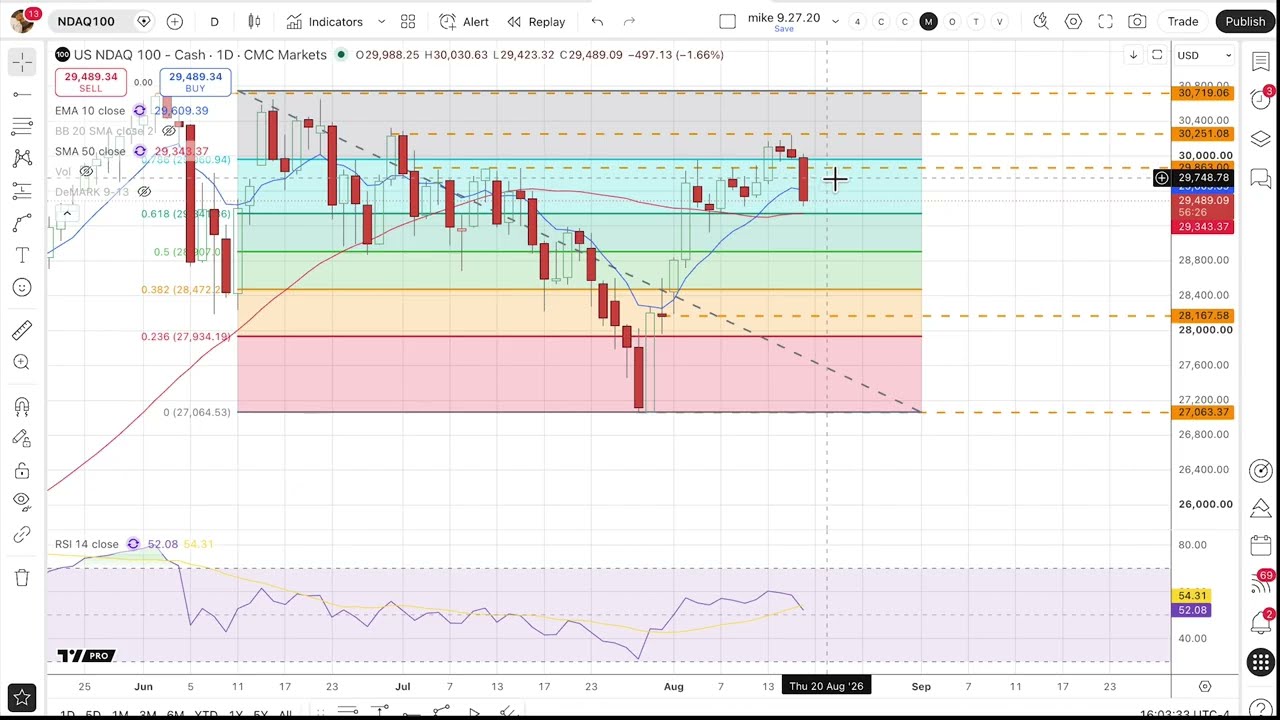
Equity markets are showing signs of weakness across major indices, starting with the DAX which has broken its recent uptrend and support around 26,100, potentially leading to further declines toward 25,520 or even the gap near 25,100 if momentum picks up. The FTSE 100 is also struggling, having fallen below its 10-day moving average and failing to reach previous highs around 10,900, with RSI indicating weakening momentum that could push the index down through support at 10,700 toward the 200-day moving average near 10,400. The Nasdaq 100 has closed below its 10-day exponential moving average for the first time since early August and failed to reach end-of-June highs around 30,250, indicating significant resistance ahead; a break below the 50-day moving average at approximately 29,300 could accelerate declines back to late July lows. The S&P 500 mirrors this bearish sentiment by closing below its 10-day moving average and breaking an apparent uptrend, though its outlook is considered slightly more constructive than the Nasdaq's, with a potential reversal target around 7,570 before facing resistance near 79.25.
Finally, the Dow Jones Industrial Average has entered a downtrend over the last few sessions, dropping below its 10-day exponential moving average for the second consecutive day and approaching the 20-day moving average next, followed by the 50-day moving average around 52,500. This trend suggests a retracement of early August gains, likely resulting in a return to levels near 52,440 as RSI momentum fades and shows bearish divergence with lower
Read the full video transcript
Hi there, this is Michael Kramer of Mott
Capital. Today is Tuesday, August 18th.
It's around 4:00 p.m. New York time. So,
the rest of the week will not be a busy
one.
Wednesday, August 19th probably is the
busiest of the days and that's only
because you're going to get Fed minutes
released
at 2:00 p.m. Eastern.
Other than that, the calendar is really
fairly light. Jobless claims on
Thursday, August 20th and then a few
other leading indicators on the 20th as
well. And then on Friday,
August 21st we'll be getting the S&P
Global Flash PMI readings for the month
of August, which will give us our first
preview in terms of some of how the
manufacturing and services sector are
going and and whether or not inflation
pressures are building beneath the
surface. When we take a look at
currencies, the euro really hasn't
changed very much. It did move up a
little bit towards the 116.10 area,
which is some an area we have been
watching now for a little bit to see if
we could get above it. You can see I
also have in here the 200-day moving
average, which to this point we haven't
been able to haven't tested it yet. I
guess the one thing that is worth
pointing out is that we have managed to
move beyond the 78%
retracement level and that is a positive
sign.
And we have basically refill basically
retrace the entire drop that was
witnessed in mid-June. So, at least from
that standpoint, this pattern looks
fairly complete. Obviously, if the euro
is going to continue to rally, it really
needs to get above the 200-day moving
average at this point. Otherwise, I
think there's a chance that you could
see a little bit of a reversal here.
Obviously, a decline below the two
a decline below the 10-day exponential
moving average would be an indication of
a potential change in trend. When we
look at the British pound, it's a very
similar story where you can see that we
have not really done very much more
recently. The 200-day moving average is
all the way down at 134, so that's
certainly not an issue at this point.
The only thing facing the pound right
now is this resistance zone that's been
built up around 135 and 1/2. You can see
we've been testing that now on a few
occasions. That corresponds to a high in
mid-July and some levels of um back in
mid-May. Uh RSI continues to basically
trend higher. So, at least from that
standpoint, momentum still looks fairly
bullish. Uh upper Bollinger band also
gives us room to continue to rise as
well
uh up to around 136.1
if we can manage to get through this
resistance region. If we can't get
through resistance, the 10-day
exponential moving average again can
serve and tell us whether or not there
is a change in trend happening. And if
we do fail at that level, then I would
expect um that we would potentially see
uh the uh British pound probably drop
back towards the 20-day moving average
and the 200-day moving average, which
resides around 134.40.
When we look at the Japanese yen, uh
there's not really much going on here
either. Although, it's kind of
interesting to see that we've just
really stalled out basically right
around this 50% retracement level if you
measure it from the top all the way down
to the intraday low, that's exactly 50%.
So, right now it seems like the market
is taking its time trying to figure out
exactly what its next move might be. Um
the one thing that again stands out,
you're above the 10-day exponential
moving average, so that could be a
short-term positive sign. You can see
there's plenty of room on the upper on
the Bollinger bands for it to continue
to expand. 20-day moving average is also
higher around the 160 level, and the
200-day moving average appears to be
holding as a support region as well.
So my guess would be as long as we can
stay above 159,
that seems to be an indication that the
yen could continue to weaken and
potentially push higher versus the
dollar. I think if we were able to
actually break below the one the 200-day
moving average and sustain that for a
couple of days, we might be able to see
the yen continue back down towards 157.
Of course, at this point the 155 level I
I still think is key. We haven't even
gotten close to it. Uh so again, right
now I think the yen is consolidating and
it looks like, you know, we could be
getting ready for a move higher if we
can just manage to
stay above that 10-day exponential
moving average and the 159 level. If we
look at Brent oil, you can see we're
still very much in the bull pennant flag
pattern that did develop and we did
break out of. Uh clearly at this point
we haven't really seen enough of a move
to really classify it as being
completed. Uh clearly we would want to
see it continue to extend. Right now it
just seems like we're consolidating
around the 10-day exponential moving
average and the 20-day simple moving
average. Clearly you can see on the
Bollinger Bands put plenty of room for
this to continue to move higher towards
$100. And again, you can see also on the
RSI momentum continues to build
favorably. So I mean, overall if this
continues to be a bullish setup, then we
would expect to see
uh the the Brent Brent oil prices
probably rise towards $100 a barrel if
not potentially further. If we see Brent
really break below the moving averages
and more importantly break below 88 and
a half, which is a recent low point for
Brent the last couple of days, that
could signify maybe reversal and that
the pattern's going to ultimately end up
failing and that could result in us
coming all the way back down towards
this 81 to 82 dollar a barrel level.
When we take a look at gold, not much
has really changed there. You can
clearly see that gold did get a little
bit overextended. We are moving back
inside the Bollinger Bands.
Um gold also did get its RSI up towards
70, but not quite there. The uh 10-day
exponential moving average right now
serving as support along with the 4,320
serving as support as well. 4,450
serving as resistance.
Uh if we break back below the 10-day
moving average, then I think there's a
chance we probably revisit 4,000.
If we can manage to get above 4,450,
which to this point we've been failing
at, then clearly there's room for us to
move back towards 4,600, but
again, the market will tell us probably
what it will want to do in this case.
The DAX had a really good run and just
like the US market starting to struggle
a little bit the last couple of trading
sessions. Uh clearly at this point, we
are below the 10-day exponential moving
average, so another day or two below it,
we need to start thinking that perhaps a
change in trend is happening. Certainly,
when we look at it from a closer
perspective, you can see that there was
a little bit of an uptrend and that
appears to be broken. Uh looks like a
break of support around 26,100
could lead to a further drop potentially
around 25,520,
which appears to be the next area of
consolidation and which coincides with
just above the 200-day moving average.
Uh ultimately, there is a gap that also
exists on the chart currently around
25,100, so there is an opportunity if
this does pick up momentum for us to
trade all the way back down to that
level, which was last seen at the end of
July. The FTSE's really been struggling
more recently. You can see came back
down below the 10-day moving average.
Wasn't really able to surpass the
previous highs up at around 10,900.
Momentum is clearly showing signs of
breaking down. We can see the RSI very
close to falling below previous support
regions around 48. That also means that
we could potentially see uh the FTSE
continue to weaken further. The next
area of support we're right at right now
around 10,700.
That was where the previous highs were
back in mid-April and also back in early
July. Uh we also consolidate there for a
couple of days in late July. So, a break
below 10,700
likely sets up a return. I think we even
go right through the 200-day moving
average back to probably around 10,400
or so. When we look at the Nasdaq 100
today, we can see we've closed below the
10-day exponential moving average for
the first time
uh really going back to the beginning of
August. That I think is an important uh
message. You can see the 50-day moving
average right below it. We only really
were able to get up to around the 78.6%
retracement level, which is also
important to note. And you can also see
we clearly failed at the end of June
highs around 30,250.
So, right now there's the market's
telling us lots of resistance up ahead.
Uh I think if we get a break below the
50-day moving average at 29,300,
call it, we could see a steeper decline
perhaps all the way back to the lows
that we witnessed uh back in late July.
S&P 500 today also closed below the
10-day exponential moving average, again
also a bearish indication. Looks similar
to the DAX in that we also broke what
was looks looking like an uptrend. RSI
is starting to show signs of rolling
over. However, this is a little bit more
constructive, I think, than the Nasdaq.
I think uh I think we're looking at a
reversal back to 7570 or so. I think um
ultimately, that's what's standing in
the way. I mean, the upper Bollinger
band uh certainly can give us a little
room to rise if it wants. The market
could easily move back up towards 79 and
a quarter. But, [snorts] we'll have to
just see how that plays out. This
obviously is also options expiration
week. So, we may also begin to start
seeing a little more volatility in the
market.
As some of those pinning effects from
options begin to fade. Finally, when we
look at the Dow, you can see it's been
in a bit of a downtrend the last couple
of trading sessions. Uh we are below the
10-day exponential moving average now
for the second day in a row. Looks like
the 20-day moving average is next with
the 50-day down around 52,500.
>> [snorts]
>> Uh again, ultimately, it looks like
we're probably retracing a bunch of the
gains that we saw at the beginning of
August. If that's the case, then we're
likely to see a return back towards
52,440
or so. Also, you can see RSI momentum
clearly beginning to fade uh and rolling
over with the bearish divergence that's
formed with the lower high uh versus the
higher high on the price index, a
negative indication of momentum. Anyway,
that's all we're going to have for this
week. We'll see you next.