Video summary
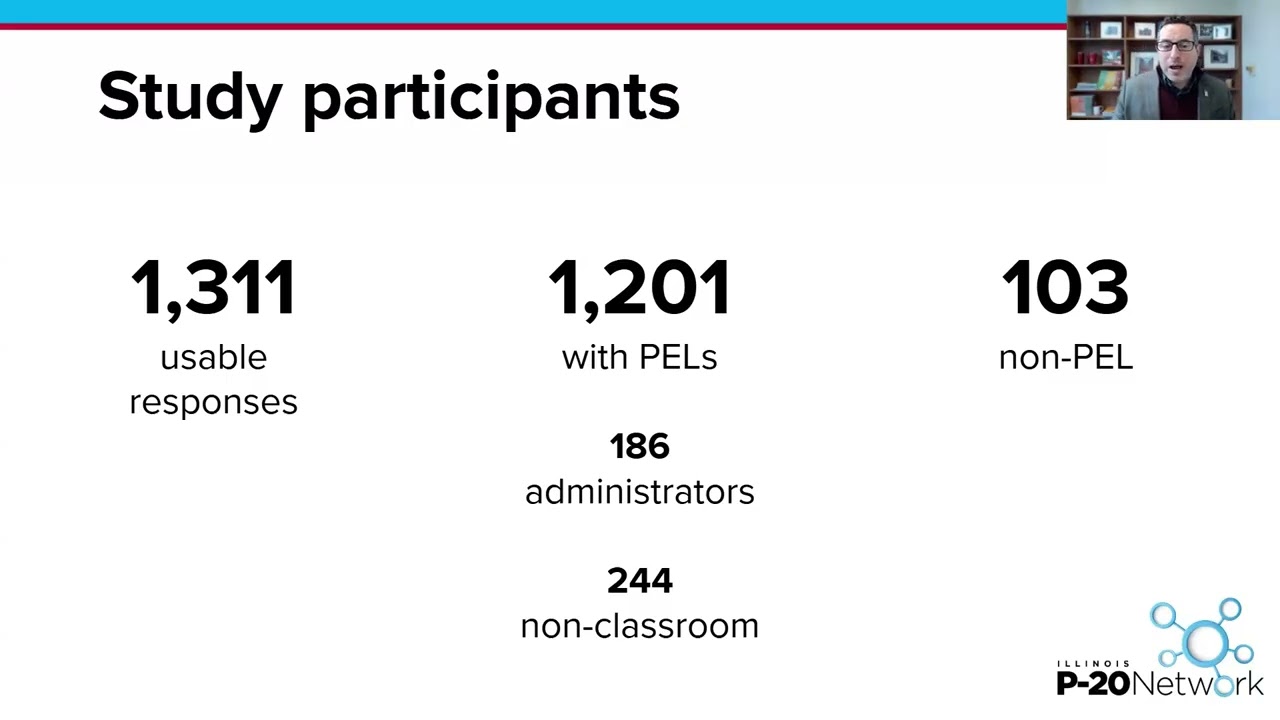
The Keep Illinois webinar presented findings from a comprehensive study titled "Defining Educator Compensation," conducted by Northern Illinois University in collaboration with the Illinois P20 Network and its College of Education. Unlike traditional analyses that focus solely on salary figures, this research investigated how educators personally define compensation within their total package, which includes benefits like health insurance, disability coverage, and retirement contributions such as TRS or IMRF. The study team prioritized anonymity in their survey design to ensure honest responses from a diverse group of participants across the state's hundreds of school districts, resulting in over 1,300 usable responses that included teachers, administrators, non-classroom staff like librarians and social workers, and paraprofessionals.
Key findings revealed significant disparities based on job type and career stage regarding how educators perceive their pay. Early-career educators with less than twenty years of experience overwhelmingly view compensation primarily as take-home pay in their paycheck, citing financial challenges such as an inability to save or purchase a home within the district where they work. In contrast, administrators tend to prioritize total pay including benefits, while non-licensed staff and paraprofessionals consistently report feeling undercompensated regardless of other factors. The data also highlighted that educators with over twenty years of experience begin to value holistic compensation packages more highly, yet even among the most experienced teachers, homeownership remains a significant challenge for many, indicating persistent financial strain across different career stages.
The study concludes that there is an urgent need to increase take-home pay, particularly targeting early-career and non-licensed educators who face the greatest economic hurdles. While state-level policy changes like increased funding or creative financing strategies are being considered by experts, immediate actionable steps can be taken at the local district level through collaborative data collection before collective bargaining begins. The researchers recommend that school districts analyze their own specific demographics to tailor compensation negotiations effectively, potentially leveraging insurance cooperatives to reduce overhead costs and redirect those savings toward direct salary increases. Ultimately, the report serves as a foundational landscape analysis urging stakeholders to use limited resources more efficiently by addressing the distinct financial realities of different educator populations to improve retention and working conditions across Illinois schools.
Read the full video transcript
Hi there. Thank you so much for joining
us for today's Keep Illinois webinar,
which we're going to go over our
defining educator compensation study. Uh
this webinar will be joined by the full
report that we'll be releasing a few
days from now as we record the webinar
and it will be included in our
newsletter on Friday, May 7th, 2026.
We will also update the description here
in the YouTube video and include the
link to the full study uh after it has
been published this Friday. So with that
said, uh welcome. Thanks for joining us
and if you have questions, we'll take
those at the end today.
So, my name is Jason Klein. I'm the
senior director of learning partnerships
here at Northern Illinois University. As
part of my role, I'm lucky enough to
facilitate the Illinois P20 Network. I
was joined on this study by Drs. Kelly
Summers and Benjamin Creed. They are
both professors, assistant professors in
our uh leadership, educational
psychology, and foundations department
in our college of education. and we did
this work together as part of the NIU
P20 research and data collaborative. So,
we're really excited to have this joint
effort between the Illinois P20 Network
and the College of Education as part of
our uh P20 research and data
collaborative and to help continue to
inform the work that uh people from
across the state have undertaken through
our P20 networks keep Illinois
initiative.
So, a couple of years ago, nearly nearly
a couple of years ago, we released a
literature review as a result of the
work of um keep Illinois participants
and that report was called the road to
retention. We'll also have that linked
in the description of the video. And
from that report, there were four
recommendations that we felt that the
research suggested. The first of those
was to uh support compensation for
educators as an effort to increase
retention. Other strategies for
increasing retention were uh teacher
leadership, professional development,
instructional coaching and co-eing and
then the culture, working conditions and
wellness of school districts and um and
other organizations in which educators
work. So things like special education
cooperatives,
etc. So with that all said, based on
these four recommendations, we looked at
the landscape of what the Illinois P20
Network was already doing, as well as
what other organizations in the state
were doing. And uh the two areas that
stuck out as being most in need of
ongoing research and support were
compensation and then culture, working
conditions, and wellness. And originally
we endeavored to engage in a study that
looked at both those areas. But as we
began the development process for this
study, we zeroed in on compensation. And
that is what we're going to talk about
today is compensation and and
remembering that what we're studying
here is compensation as one driver
potentially of educator retention. Now,
our study of compensation took a little
bit of a different angle and we decided
to study not how much money people make.
That data is available. We could have
asked Isby for that data. There's
publicly available data for each school
district in the state on the report card
in average teacher salary and average
administrator salary. Um but instead we
said what does compensation mean to
educators? Let's take if we're going to
do this research, let's take a step back
and try and understand that because of
course compensation I as any chief
school business official or assistant
superintendent for human resources will
tell us or frankly anybody schoolboard
member uh union leader that's on a
collective bargaining team would tell us
there is a lot more dollars being spent
as part of our overall compensation
package on things like health insurance
and dental and disability, our TRS
contributions or our IMRF contributions
depending on one's role in an
organization. So, so that's what we were
here to look at. So, with that said, the
methodology that we employed, this was a
a survey study and this was an original
survey that we created. It was tested
internally at niu and with the field
testing particularly focused on survey
clarity uh as well as time to
completion.
We also engaged in with a number of key
communication partners to help get the
survey out. Those partners included the
Illinois State Board of Education, a
wide range of statewide professional
organizations. their help was invaluable
on sharing out the survey and the
partnership with the Illinois Education
Association which uh highlighted the
survey directly with its members across
Illinois.
One of the difficult sets of decisions
we made in developing the survey was to
really heir on the side of focusing on
anonymity. uh knowing the wide range of
school districts in Illinois with
hundreds of small districts, we really
wanted to ensure that not only would
participants in the survey be anonymous,
but that they would feel like they were
anonymous. So, as a result of that,
there were some key questions that we
chose not to include. We didn't ask
participants if they were a TRS or an
IMRF employee. To some degree, we can
make uh assumptions about that based on
one's self-reported position um but not
entirely. For example, there are
administrators that are IMRF
administrators in operational areas of
school district work, for example. We
also did not ask uh whether people were
tier one or tier 2. And again, while we
did ask about their years of experience
in Illinois and in their current school
district, we can't just make assumptions
based on that, unfortunately. And and
again, we chose not to ask this to
preserve anonymity. And then we also
chose not to ask about a variety of
demographic fields that you would
normally ask respondents about, but in
this case, we felt like it would
preserve anonymity. And and
while would be very interesting and
potentially very important in helping
further understand how different
educators define compensation
differently, we decided to hold off on
this case. What we did include, and this
was optional, you did not need to
respond to this, was the identification
of your school district. And when people
did select their school district, that
we were clear about this in the survey,
that was going to allow us to then pull
in publicly available data from the
Illinois school report card and and be
able to potentially look at uh factors
across districts. Uh finally as once we
had all the data and were beginning to
um initially understand what was in the
data, we created some some fields that
did not end up being quite as critical
for the research uh as we had envisioned
when we created them but might be useful
for future research. Um the first was we
created this administrator toteer salary
ratio um that could be very helpful when
looking at issues around compensation.
For that we simply use the ISBY publicly
reported data for those fields. The
average administrator salary and the
average teacher salary. There would be
more nuanced ways to look at that um if
conducting this research specifically on
that locally. Um again that field did
not end up being something that we
utilized but we wanted to call it out as
part of our process of working through
the survey data. We also looked at the
available uh fields for district
geographic location and diff district
size that were in use in the state of
Illinois and we felt like for this study
the existing fields were not kind of
didn't hit that that goldilocks just
right measure. So, so we created some
new fields for those and um we won't we
won't go into great detail on those
here, but we'll we'll briefly touch on
them in this webinar. So, let's look at
who responded to the survey. And the
survey was given last spring, a year ago
at this time, and that was a very
intentional time frame. And so, in terms
of who responded, at the end of the day,
after we had cleaned the data, we had
over,300 usable responses. Of those 1300
usable responses, 103 were
non-licicensed educators. They did not
have a PEL or a professional educator
license. Uh there were over 1,200 with a
PEL. And of those 1,200, the vast
majority were classroom teachers of all
different kinds, but we also had 186
administrators and 244
non-classroom
non-administrator PEL holders. So those
those folks are people like school
psychologists, school social workers,
speech language pathologists,
librarians, instructional coaches. All
of those positions would fall in that
category of 204 uh individuals who
responded with Appel but who are not in
a classroom role right now.
We did ask people about their highest
postsecary degree that that becomes
pretty important uh oftentimes in
people's actual compensation. Uh and we
had a lot of respondents who had
graduate degrees uh including multiple
graduate degrees and even a number with
doctoral degrees. And so this does skew
to to the right a bit uh as you're
looking at this graph in terms of who
our respondents were and and the
percentage of them that that had
advanced degrees.
The years of experience in Illinois,
pretty wide range of years of
experience. We can see the the
bell-shaped curve here. Um we've got uh
quite a mix from early career educators
to experienced educators with the bulk
of the respondents um having um
somewhere between five and 30 years of
experience. So being in the middle of
their careers,
the years of experience in the current
district shifted significantly from how
much experience they had in Illinois.
So, one of the things that tells us is
this speaks to some mobility among
respondents of moving districts. And so,
um, what we don't really have is how
that compares to the population of
educators statewide, but it's it's
interesting to note and probably
important to note, um, that people who
have responded this survey uh, have been
in their current districts less years
than they've been working in Illinois,
which suggests they've been working
other districts in Illinois previously.
So in terms of districts, uh 972
of the 1,311
respondents did identify their district
and there were 228 districts that were
identified. So about a fourth of
Illinois school districts were
identified. Now, how many people from
each district participated? Well, there
was a very wide range from as few as one
respondent to as high as 82 respondents
from a single district. It's important
to note 130 of the districts or more
than half of the identified districts
only had one response. So, we're going
to be cautious about drawing conclusions
about districts from this. Um, just like
we're going to be cautious about drawing
conclusions about the whole population
of educators in Illinois. uh given that
there was less than 1% of uh educators
who responded to the survey, even
despite the significant outreach efforts
statewide over a a two-month window last
spring with some really high-profile
organizations.
So, where were the districts that did
response? Well, here we can see on this
slide we do have a good mix of of
Illinois districts here. So on the on
the right side from very small to very
large, we have districts across that
continuum. Um, and frankly, and this is
in the written report, we'll see if I
get the numbers exactly right as I'm
doing this off top of my head, but I
think our smallest district represented
had 146 students and our largest
district represented had hundreds of
thousands of students. And so, uh, we
had a quite a range. We also quite a
range geographically. And while we've
reported here in the raw numbers, one of
the things to remember is that the
numbers of districts in some of these
regions are much smaller than the
numbers of districts in other regions.
So again, we had a real wide mix.
Another factor to consider when thinking
about district numbers is which regions
have a mix of elementary and high school
districts where you'll often have
anywhere from 2 to 10 districts that
would that would make up a single unit
school district that goes from prek
through 12th grade. And so so that also
skews how many districts there are in
each of these regions. but pretty
diverse representation of school
districts that match the range of
districts that exist across the state of
Illinois. We were quite pleased with
that.
So,
I've said some of these things already,
but just to summarize who our study
participants were, uh, pretty high
degree attainment. Lots of people taking
this survey with at least a master's
degree and in many cases multiple
graduate degrees or certificates. Uh
we've got some evidence here that the
participants who responded to the survey
uh have more mobility
um because they've been in their current
districts for fewer years than they've
worked in Illinois. uh we have strong
diversity of districts that was
represented in this survey and and again
we do need to remember that while in a
lot of ways this population of
respondents or the sample of respondents
represented the population of the state,
it's a very small percentage of the
overall population of Illinois
educators. So we want to take some
caution in drawing conclusions, but we
still think this study uh provides a
great landscape analysis and foundation
for additional research work that can be
very very important uh particularly in a
world in which we need to use our
resources or limited resources as
effectively as possible. So what do
educators think of their compensation?
Well, educators
across all types of educators uh and
everybody all 1300 people plus who
responded uh we see there's a wide range
of answers to whether they view
compensation is take-home pay, total
pay, versions of total pay, um and how
that plays out. A large a large
percentage do view take-home pay uh as
being their view of compensation
versus total pay uh which would include
insurance, other kinds of benefits
including things like tuition
reimbursement,
etc.
So now we're going to break it down and
look at it through a few different
lenses. The first we're going to look is
by job type here. So non-licensed
educators view. So typically these would
be paraprofessionals.
Um we see a higher percentage here
viewing their compensation as as being
rooted deeply in take-home pay.
When we look at teachers and other
notadministrators who have a
professional educator's license, we see
a similar pattern with it being deeply
rooted in take-home pay.
When we move to administrators, we see
it shift and the shift here is to total
pay plus all other benefits.
Now, we have some thoughts and ideas
about that, but they're just thoughts
and ideas. And so, again, this is this
is what we know from the research we
conducted here. We definitely think as
we'll talk about at the end of the
webinar, there's room for further study
here. now that that this study can
direct us towards pretty specifically.
Now, we're going to look across the
years of experience, and this is the
years of experience teaching in
Illinois, not just the years of
experience in their current district.
And so here for our less experienced
teachers and other educators, we can see
again take-home pay, the the multiple
categories that call take-home pay, the
majority of responses fall into those
categories.
As we move through the years of
experience, we see that pattern
continues to hold through 5 to 10 years
of experience, 11 to 20 years of
experience. And then once we get beyond
20 years of experience, we see it shift.
And this is not the only time we will
see that shift happen like that. And now
total pay starts to take precedence. And
by the time we look at our most
experienced educators who are also
typically our most highly paid
educators,
total pay becomes the priority in terms
of how they define compensation.
So we've got a number of key takeaways
and when you see the written report when
it's released on Friday, you'll be able
to to drill in and read these right off
the bat in the executive summary. We're
going to call each of them out here and
provide some supporting data for each
key takeaway. Some of this will get a
little redundant uh because the same
data points to multiple takeaways. So
the first takeaway, unsurprisingly,
educators want to be paid more. So, some
of the data that pointed us to this key
takeaway is that all respondents
feelings about whether or not they're
well compensated. We've got quite the
bell curve here and it it really
distributes uh across a very normal
curve here. Um but it does skew a little
bit to the right um when we look at all
respondents. Now, the story starts to
look different when we look at it by job
type. For example, none of our uh
non-licensed educators who responded
said that they were compensated very
well and and only a handful said that
they were compensated well. Whereas a
large percentage, the majority uh by far
said they were compensated either not
well, poorly, or very poorly.
When we look at teachers, uh, the curve
evens out a little bit, but it still
skews to the right, uh, a little bit
with, um, but it's pretty even. And
again, there's there's a lot of
potential research here that could be
done as a followup. um looking in more
detail different types of teaching
roles, the grade levels student uh
excuse me that educators are working in
the geographic regions and and that was
the kind of work we had wanted to do
with the geographic regions but we feel
like we need more data from more
districts to be able to do that
effectively. So we point to additional
work that that can be done now in this
direction. And then when we look at
administrators, we see the polar
opposite of um the feelings that that
the paraprofessionals had in terms of
their feelings about their compensation
uh with the majority feeling like
they're being paid adequately well or
even very well.
Years of experience tells a similar
story. Now, this is a more condensed
data graph to look at. Um, but the the
navy blue bars on the left of each
cluster are the 1 to four years of
experience and the purple bars on the
right of each cluster are 31 or more
years of experience. And if you start to
look across the colors, uh you see a
shift though though the pattern is
fairly similar across years of
experience. There is a noticeable shift
um that we see as people uh have
significantly more experience from their
counterparts who are in the earlier the
middle parts of their career. Now when
we look across all three job types,
still the most frequent response in each
among respondents from each job category
is the area of compensation they would
like to see improved is additional
salary as take-home pay. So that is loud
and clear. That is a consistent message
here. And that's part of all of this
together is how we come up with the key
takeaway that educators would like to be
paid more. Our next takeaway is this
one. For early and mid-career educators
with less than 20 years of experience,
increasing take-home pay in their
paychecks is their most important
compensation priority. And and we see
some of that evidenced here. Again,
these are things we've looked at
already. our our newest educators are
telling us our educators with the least
experience are telling us take-home pay
is most important. Um and and we see
that consistent to consistently being
true until we have 20 years of
experience. Similarly, when we asked
about their ability to save, one of the
things that we have found is educators
with less than 20 years of experience
um
have less of an ability to save. They
are pretty consistent in in answering
that question. And so that's not only
our first through fourth year teachers
or our fifth through 10th year teachers.
That also gets into our teachers who
who've been in the profession for a
while. Um and we see it here on on
questions around living um you do or you
can live in the district. We've got a
pretty high percentage all the way
across. But when we look at
homeownership on the right side of the
graph, um over half of the respondents
uh have essentially told us that home
ownership is a real challenge. Um until
we get to that most experienced
category of educators, 31 or more years.
And even there, it's only 55.6%
that's saying they own or can own a
home. um in the district like that. And
so
there's if home ownership is one of
those uh bellweather figures for uh a
solidly middle class experience in the
United States of America. Uh we're
seeing that being uh a trailing factor
here for many educators
as we've just seen from our data on our
1 to fouryear our 5 to 10 year and even
our 11 to 20 year educators um having
challenges and and seeking take-home pay
additionally as the antidote to those
challenges. We can see here that for
later career educators with more than 20
years of experience as well as for
administrators, improving overall
compensation is their most important
compensation priority. So they're
they're not just looking at take-home
pay. So this is another key takeaway.
And we see that here where um once
you're beyond that 20 years while
take-home pay still has a very high
percentage there are increasing
percentages of other of educators that
responded to the survey saying hey total
pay is really important to us and and
when we get to 31 plus years of
experience all of those other views of
of compensation holistically definitely
take root.
with administrators. We looked at this
already. We see that administrators feel
like they are well compensated and and
when we see the ability to save, we
again see that our most experienced
educators
um have a much greater ability to save
according to their own self-reporting
than do newer educators who responded to
this survey. We looked at that home
ownership data according to years of
experience as well.
For non-licensed educators, primarily
paraprofessionals, increased take-home
pay was again their most critical
compensation priority. We've already
seen this in the data. Um they don't
feel like they are being well
compensated. Um, we look specifically at
the ability to save by um by job type
and we see the non-licensed on the left
side of this graph. um there are almost
no one who is able or easily able to
save. Whereas with administrators,
there's a large chunk that are able and
easily able to save. And and with
teachers uh and other non-administrator
PEL licensed staff, we see a a not quite
a normal distribution curve as there's
not many who are easily able to save um
but more of a normal distribution to the
data.
This is another interesting factor when
we look at other employment. We asked
about who has another job outside of
their work for their school district
during summer and who has another job
outside their work for their school
district during the school year. And
unsurprisingly,
a large percentage of our pair of
professionals, 57.3%
who responded said they are working
during the summer in another job. and
over a third of them, 35%
are working another job during the
school year. What is interesting is
those numbers were not far off the
numbers of teachers. Now, one of the
things that we did not ask about that
again would be worthy of additional
study is what are these other jobs?
Which of these other jobs are different
people doing that are additive to their
current job as a as a school district
employee and which are completely
unrelated or maybe even subtractive to
their school district employment? So,
for example, if administrators are
teaching coursework for universities,
that may be very additive. They're
growing as learners. They may even be
finding employees, future employees to
hire through that process. um versus if
I'm uh working another job for a
delivery company or in a warehouse
setting and very tired three nights a
week and one day on the weekends, uh
it's hard to physically recover as a
paraprofessional who may also have a
very physically taxing job at school
working with students each day. And so
that would be an example of a job that's
subtractive. We didn't go there in this
study, but we think this data raises
some questions that are are worthwhile
for future study.
Home ownership story here for
non-licensed paraprofessional staff,
very few saying they own or can own a
home. Um, very few. And so that's
important to call out and again leads us
towards this key takeaway that uh
significant increases to take-home payer
are what they're looking for.
Then this key takeaway,
the time to retirement for tier 2
educators is overwhelmingly considered
problematic. Now remember, we did not
ask respondents, are you a tier one or a
tier 2 educator? But
we found that everybody gave us the same
response regardless here. So we asked
about the time to retirement for tier
one educators. What were respondents to
the surveys feelings about that? And we
see again a very very normal
distribution like we almost could not
have made a more normal distribution
here uh from outstanding to terrible.
And we did allow for the I don't know
for people who may not have know about
what what that looks like for tier one.
But we contrast this when we flip over
to the next slide and we asked about the
time to retirement for tier 2 educators
in Illinois.
And overwhelmingly
cross experience, cross job type, uh
there is a very significant
uh feeling that it is either not so good
or frankly terrible. And um and so uh
that that was pronounced here.
So in terms of policy considerations,
we've got some state level thoughts that
are re just the initial formation of
thoughts. They are not anywhere near
ready for some kind of legislation or
policy action. There is a lot of work to
be done by a lot of stakeholders, by a
lot of researchers before these thoughts
can be formed into policy
considerations. And then we've we've
actually got some some thoughts that are
a little more wellformed in terms of
process of what school districts can do
to use this information um for their own
collective bargaining and compensation
decisions. So first at the state level
um increasing take-home pay is I mean
there's a clear call for that here. We
see it in two of these three bullets.
And so couple of ideas there. One is a
call to action for economists, public
finance experts to put their heads
together and say, "What are some
creative ways that we could increase
take-home pay without maybe
significantly increasing or possibly
increasing at all the resources that are
available for educator compensation?
That's the the real magic, right? And
again, similarly, um a question of a
policy consideration. Should there be
increased take-home pay that targets
additional funding for early career
educators to help keep them in the
profession until their their funding
gets to a certain level to some degree
the legislation from a few years ago to
set a statewide minimum salary. Um did
do this. Um likewise there could be
targeted funding to support specialized
areas of educators areas that the
shortage is particularly averse and that
there's great need in school districts.
So early childhood special education
bilingual ESL career and technical
education would would tend to be the
areas that would be foremost among um
the the educator areas for further
conversation. And then one of the areas
we explored briefly but think may have
some potential and again requires a lot
of additional effort uh additional
research and analysis
certainly stakeholder engagement. It's
it's not ready for prime time now though
there have been some efforts in the last
few years to move in this direction
direction is to find ways to to better
um support the efficient use of existing
resources. So supporting insurance
cooperative, school districts have moved
to insurance cooperatives
significantly over many many years and
and that is very common now. Um allowing
districts to participate in statewide
state of Illinois insurance um or other
solutions that might lower school
district insurance expenditures. I I
mean, we're recording this the week
after the Illinois Association of School
Business Officials held their annual
conference in Poria this year, and it
was not uncommon in the hallways in the
lobbies to hear uh school business
leaders from across the state say to
each other, "How much is your health
insurance going up next year?" and um
numbers were often around 15% but
numbers 19 and 20% were not unheard of
in those conversations. And so, um,
looking at where where maybe those
insurance costs can be lowered and
capped, um, and supporting school
districts with that could allow some of
that money to, uh, certainly go towards
additional compensation in the form of
take-home pay or towards other district
needs as well. Now, for local actions,
again, it we focus more on process uh,
that we learn from this. And so one of
the things we're suggesting is beginning
with local data collection. So we've
asked here statewide, hey educators,
what compensation is important to you?
And we've seen some patterns, but
there's no reason a district locally
couldn't 6 months before, 4 months
before collective bargaining begins
conduct the same research locally and do
it collaboratively where um
administrators uh union leaders and and
even board members are all analyzing
that data together. Uh in the written
report in the appendix we have a version
of the survey that could be could be
given as a local survey to understand
your local stakeholders
compensation definitions and then
instead of just doing what you've always
done if there are some changes based on
the needs of your school district. For
example, if if you have a large group of
retirees or soon to be retirees, excuse
me, um you might negotiate the contract
differently than the contract after
that, which will likely have a large
group of first through fourth year
teachers. Uh we see that that statewide
there's some different needs based on
this research. You can find out locally
if that's true. Um, and so then once
you've got that data, being really
creative and finding ways to meet
different employees needs. We think that
both IEA and IF along with IASPA and
IASBO can be real leaders as districts
find creative solutions that work for
them to help share out those solutions
um with both administrators and um and
with union leaders as well as then
through IASB with schoolboard members
across the state. And then again, one of
the things that will probably come out
uh based on this data in in local data
is how do we prioritize increasing
take-home uh pay for less experienced
employees and non-licensed employees.
So, further research opportunities, um
there's a lot here. If you are thinking
you're going to pursue a um a degree uh
graduate degree, a doctoral degree in
particular, you you've got some stuff at
the end of this report that you can
certainly peruse and consider as as
potential research opportunities. So
everything from um student loan debt, we
asked some questions about that that we
didn't share here, and homeownership um
to educators budgeting and spending
habits uh are all interesting topics for
further research. studying um educators
um receive money to to lead
co-curricular activities and and to
provide supervision in in many if not
most school districts. How does that
money impact um their individual lives
as individual educators and how does it
impact school district budgets overall?
Um further study around employment
outside of the school district. We've
talked about that. um tier 2, TRS, IMRF.
Um, another interesting topic is we know
that career and technical education
teachers are one of our areas of
shortage and um, pay retirement and
retention can look different when you're
coming from a job where making maybe you
were making 80 to $100,000 a year and
now you're going to make $45,000 a year
and you're a new teacher and so it's
hard and it might be attractive to go
back to making $90,000 a year in in in
that profession instead of teaching
about that profession. So, lots of
topics here for future research. Um,
finally, we really appreciate you
joining us and and being with us to
learn about this. Again, we will be
releasing the study itself this Friday
in our newsletter and it will be on our
website and we'll add the link here to
the YouTube video. So, um, thank you so
much for for joining.