Gor Sahakyan, Yeva Yeghoyan | Bioimpedance Spectroscopy Non-Invasive Tissue Analysis
Watch on YouTubeVideo summary
The presentation introduces a capstone project focused on developing a bioimpedance spectroscopy (BIS) system designed for non-invasive tissue analysis, bridging electrical engineering with clinical diagnostics. The primary motivation behind this device is to address a critical gap in monitoring cancer survivors who are at high risk of developing lymphedema, a chronic condition where fluid accumulates in the limbs. Traditional detection methods often wait until fluid volume reaches approximately 300 ml, by which time the condition has become difficult to reverse; this new system aims to detect physiological changes much earlier. Additionally, the device targets athletes who require precise tracking of body composition metrics such as fat mass, muscle mass, and overall hydration levels, offering a portable and cost-effective alternative to bulky medical equipment for long-term home monitoring.
The core technology relies on injecting low-level alternating currents, specifically around 400 microamperes within a frequency range of 1 kHz to 500 kHz, which is safe according to ISO standards as it avoids nerve stimulation or tissue damage. The system utilizes a four-electrode configuration where two electrodes inject current and two measure the resulting voltage drop, effectively eliminating electrode impedance errors that could skew results. By sweeping across different frequencies, the device distinguishes between extracellular fluid at lower frequencies and both intra- and extracellular compartments at higher frequencies. This process models the human body as an RC circuit, allowing the system to calculate reactance and resistance at various points to assess cell membrane health through metrics like phase angle and characteristic frequency.
The technical implementation features a custom-designed PCB that integrates a function generator, current pump, instrumentation amplifier, and data logging capabilities controlled by an STM32 microcontroller. The hardware captures signals using high-resolution ADCs and visualizes the results on a Nyquist plot, which graphs resistance against reactance to reveal distinct differences between healthy and unhealthy tissues. For instance, the team demonstrated that unhealthy tissue exhibits significantly lower phase angles and characteristic frequencies compared to healthy tissue. The software analyzes these raw measurements using validated biological formulas that account for body geometry, treating the body as a combination of cylinders rather than a uniform shape to derive accurate data on total body water and fat-free mass.
While the current prototype is non-invasive, portable, and capable of real-time multi-frequency analysis, it faces limitations such as the need for careful calibration, complex data interpretation, and potential errors from poor electrode contact. The team acknowledges risks like the lack of built-in error handling and the possibility that users might confuse monitoring with treatment, planning to mitigate these in future iterations by integrating self-testing hardware, adding battery power for independence from PCs, and using 3D printing for more durable cases. Furthermore, while the device currently relies on statistical data from established research to compare individual results against healthy baselines, the developers emphasize that their multi-frequency approach provides superior personal precision over single-frequency smart scales that depend heavily on population averages.
Read the full video transcript
[music]
Hello everyone, my name is Yava Hoyan
and today my teammate Gorsa Gan and I
are going to present our capstone
project which is about bio impedance
spectroscopy system for non-invasive
tissue analysis. Bio impedance
spectroscopy or BIS is a powerful bridge
between electrical engineering and
clinical diagnostics. Hence our goal was
to create a system which will have a
high precisioned uh output um which will
help us to understand the physiological
changes of the tissues.
To give you an overview of today's
presentation uh we will start to by
understanding the core clinical problem
and our target groups. Then we will
introduce our hardware specific solution
and the fundamental science of what is
PIS and how it works. After that we will
dive into the technical implementation
of our design uh the block diagrams
custom PCB and measurement results and
we will conclude with the comparison of
our device with an existing technologies
analysis of risks uh as well as um our
vision for the future iterations.
[snorts]
Um our primary um motivation was uh for
this project uh lies in a significant
gap uh in a current clinical monitoring
specifically for cancer survivors. After
treatment they uh face a high risk of
the of getting the lympadema which is a
chronic condition uh when fluid builds
up in the limbs. Um in a traditional
method it can be detecting uh when the
fluid volume is reaching roughly roughly
300 ml uh and by that time uh the
condition is already chronic and much
more difficult to reverse and that will
create a wait and see a state of anxiety
uh for the survivors. Beyond that, our
device serves uh for athletes for
monitoring their body composition such
as fat mass, fat-free mass, muscle mass
uh and uh for tracking their overall
hydration for their um body.
Um our solution uh was designed uh to uh
generate, inject and measure the
electrical signals at a high precision.
uh it should uh generate um electrical
signal signals uh inject the current and
also do a data logging. Uh as you can
see it's uh it is a cohesive unit that
integrates uh all of that um [snorts]
>> components. Uh so um uh we have uh the
data which we will get uh from the uh
analog hardware that we have. Then this
data will be sent to uh to the PC when
our software will conduct the analysis
and visualization. Unlike bulky
equipment, our uh device will be
portable, cost effective and will ma
make the long-term monitoring for the
health uh a reality for the people for
on their own homes.
So what exactly is bio impedance
spectroscopy? At its core, it it is a
measurement of the flow of an um of the
body's opposition of the flow of an
alternating current. Uh we are using
this um frequency spectrum range uh from
1 kohz to 500 kohz and we are injecting
a really low level current um to them
into the human's body uh for about 400
micro ampers. um based on the a um ISO
standards, we're not allowed to inject
more than 1 milliamper which is al also
uh very low for having the nerve
stimulation or any tissue damage.
Uh now let's understand how it works.
The accuracy of our system relies on a
four electrode or tetropolar
configuration. We're using four four
electrodes. Two for injecting the
current and two for measuring the
voltage drop. This is crucial because um
it eliminates the impedance of the
electrodes themselves. Otherwise, it can
skew the results and uh the spec uh
spectroscopy aspect of our system is
that we are sweeping across the ranges
of the frequencies. As I have mentioned,
we're not using any frequency which is
below 1 kilohertz because in that case
the current uh penetrates only um in the
extracellular spaces as you can see
here. However, at high frequencies it
can go uh to the both intra and
extracellular compartments.
>> Uh hello everyone, my name is Gore and I
will talk about how our BIS system uh is
implemented. uh as you have already
mentioned we use the tetropolar
uh electrode configuration and we can uh
depicted the human body as a RC circuit
with a parallel of R. So when we
injecting the current through this
circuit uh it happens the voltage and
current uh phase uh changes and via the
increasing of the frequencies this delay
became higher and higher. So every point
we can uh conduct and uh calculate the
reactance and the resistance of this
similar circuit in the different
frequencies and uh get the result of the
low frequencies for the extracellular
and the higher frequencies for both
extracellular and intracellular.
Uh here uh for confirming uh our
measurement method correctness we
connect uh to our uh system capacitor
and at the which is on the uh left side
and you can see that uh we are
increasing the frequency the delay
between uh
the delay between uh current and voltage
became more visible. And at the right
side I connect uh the system uh to my
hand. And here you can see
uh that it adds some noises because our
hand is not the ideal capacitor circuit.
And uh during the uh highest frequencies
you can note that the uh phase uh
between the voltage and the uh current
changes as well. So this confirms the
correctness of the measurement.
Uh here is the block diagram for our
system. Uh we use the controller for
controlling the function generator. This
function generator uh is the reference
uh signal generator for our system.
After that we need to amplify that
signal and convert it to the current.
Then we inject it through the body uh
and use the analog front end with which
is uh in this case the instrumentational
uh amplifier
uh this is the human uh body for the
measurement devices and then we use the
higher resolution highspeed ADCs for
capturing the signal for the f far
further analysis
for the controller we use the STM32 uh
blue Bill uh this control uh the
function generator AD983
uh 33. So we also connect the push
button it used to start the process. Uh
we also has the LED. So when we but when
we press the button LED turns on and
indicate that the process has started
and after the process is completed the
LED turns off.
uh as I already mentioned we use the uh
9833 function generator. This is the
reference and this creates the signal
from 1 kHz to 500 kHz with a sweep of 10
kHz step.
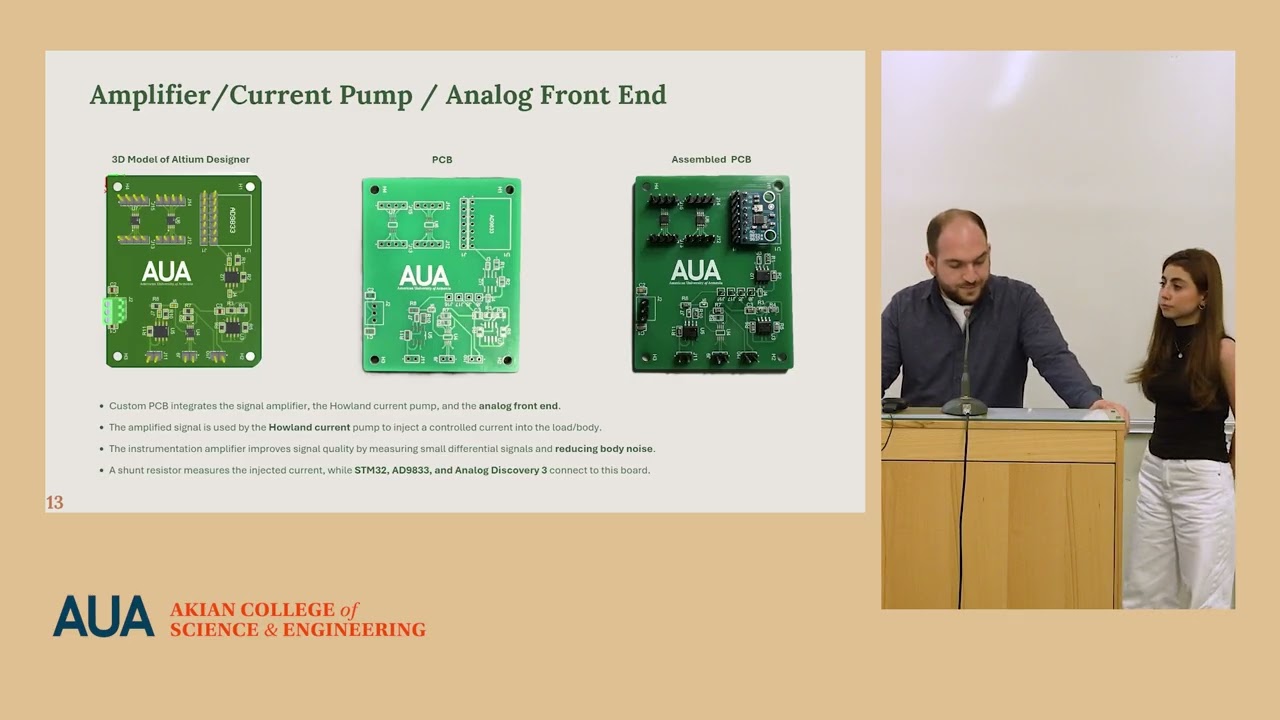
Uh for the amplifier current pump and
the analog front end we designed the
custom PCB. Here you can see that we uh
at the uh left corner the 3D model
created in the Altium designer. Uh at
the center uh we use the fabricated uh
in empty PCB and on the right side you
can see the fully assembled and
functional uh PCB. This [snorts] is also
act as the main hub of the hardware of
the system because all the parts uh
connected to it.
Uh so uh this is why we uh create the
custom PCB.
Uh here is the schematic of this PCB.
Here you can see the part of the
function generator, the amplifier, the
current pump, the instrumentation
amplifier. Also here is the shunt
resistor for the current measurement and
respective the amplifier for that. Uh
for the further iteration we also add
some uh high resolution high uh speed
ADCs. Uh you can also see that we use
these uh jumpers to isolate each
component uh from each other because
this simplifies the troubleshooting step
uh during our project.
Uh for capturing the signal we use the
analog discovery tree uh device. Uh this
device has two differential oscilloscope
channels which allow us to uh parallelly
uh measure phase difference between the
voltage and the current. For uh analysis
we use the love view environment for
capturing the signal uh and uh for the
further analysis and also for data
logging. Uh we also use this device for
supplying bipolar power supply for our
op pumps.
uh plus - 5 volt.
Uh for the analysis we use this call
graph. Uh here you can see that the
x-axis is the resistance, y-axis is the
reactance. Uh we have a few terms R0 uh
which represent the impedance in the
lower frequencies. R infinity which
represents the uh the impedance in
higher frequencies. Here you can also
see the term of phase angle and the
characteristic frequency. Uh these uh
terms speak about the healthiness of the
cell membrane and they direct
proportional to each other. So higher
the phase angle uh higher the
characteristic frequency healthier the
cell membrane.
So we use our uh measurement and uh
create the call graph. Uh from the left
side you can see uh graph created by our
devices which measured uh my body
[snorts] and we use the uh literature
information. They use the similar setup
uh with the similar frequencies with the
similar sweep step uh [snorts] frequency
and measure the unhealthy tissue which
has the problem with the same membrane.
Here you can clearly see the difference
of the phase angle and also the
characteristic frequency. [snorts] Uh it
is much lower than the healthy tissue.
Uh also you can see the difference of
the R0 and R infinity parameters. They
much lower than uh healthier ones.
>> So as Gore has mentioned um we're
getting the reactance and the resistance
for the results. Uh after that the most
important part part is phase angle. So
higher um it is the healthier is the
tissue. However it is important to note
that uh where we should integrate more
tools uh additional tools besides our
device for getting the corrected phase
angle uh to have fully precise result.
Uh now we have the measured one uh which
is very close to the actual phase angle
but with the integration of additional
tools we will get fully corrected one
[snorts] and from that uh from all of
that formulas uh we get the biological
formulas that we need for example for
body composition or for the hydration
level. uh these formulas are validated
from the company which is specialized in
this field and have their own researches
uh according to this um topic. So we uh
took this formula to test our
measurements. Uh and here we can see fat
free mass, fat mass or even total body
water. And the most important part of
this is um the volume formula uh which
is um uh which has the KB constant. As
you can see this constant is crucial cuz
uh it treats our body not as a uniform
cylinder but as a combination of four
cylinders and for the adults there is a
general constant for that of 4.3. So we
just plug those values and the personal
reactance resistance or other uh body
parameters and getting our our results.
>> Uh here is the uh feature and the
limitations of our system. I will
mention a few of them. Uh we can say as
a feature that it is noninvasive. So it
is safe and painless. It is portable
because we can use it in the home or
point of care whatever we need. It is
multi-frequencies
uh compared to the single frequency
devices. Uh so it has the higher
accuracy. It is cost effective and it
allow us to make the realtime uh
monitoring. uh as a limitation uh it
requires care careful calibration
protocols uh and it needs to complex
data interpretation also uh bad uh
connected electrode can affect by uh un
unexpected results. So that's the
features and the limitations.
Um now here we can see the compare and
contrast table for our device and two
other devices which have some
similarities with our device. The first
one is the smart scale. The smart scale
is based on the single frequency
analysis which is mo mostly statistics
rather than personal um output for the
person. Uh the last one is uh imaging
machines which are very good if you want
the detailed anatomical details of your
body. However, our device is something
in between. It is cost effective and
portable and it can give you also the
details of your body, not too detailed,
but the hydration level or body
composition if you want to track it uh
on a daily basis.
Um here are some risks that we have for
our device. The first and foremost one
is that um our device is in its initial
stages of the development and we do not
have the error handling yet. So if
something breaks inside of the system,
the user will not get the alert of this
and this will lead to a need for the
recalibration from the professional
repeatedly. Uh also there is a risk that
even though we can uh detect the
condition from the early stages, the
doctors may not act until it is visible
for them. uh and also that the customers
can uh confuse our system with the
treatment and miss their um visit to
professionals. Uh but it it is important
to understand that it is not a treatment
or something like that. It is just
monitoring uh if you want to do it
regularly and it is important to have
your treatment uh outside of this device
usage.
uh about the future development and the
iteration uh we consider to change
analog discovery tree with the high
resolution highspeed ADCs. This will
allow us to reduce the cost about 80%.
Uh we also consider to add uh some
lithium ion batteries and use the mobile
bio application for for the data
interpretation.
This will allow us to uh make the device
more independent from the PC uh or the
laptop and we as use uh as we use the 3D
printing for the prototyping the case we
plan to change in more durable one. So
in addition uh during the poster
presentation
uh some people from the oral uh approach
us and uh make an offer for collaborate
collaboration
uh they made the device uh of high
voltage uh way uh to inject the uh cell
membranes. So their device uh don't have
capability to measure the impedance and
our device has. So they plan to
collaborate and integrate our device to
their systems.
>> Um to conclude, we have successfully
built a device which is non-invasive,
portable and cost effective for
monitoring every health metric that you
need in your everyday life.
>> Thank you. [applause]
Great work.
>> Thank you.
>> And uh can you go with the slide back
where you have the the problems list
that you have mentioned?
>> Right.
>> Risk.
>> Yeah, this one.
>> Have you done some risk mitigation study
of like for the listed items? Any
thoughts on how you can mitigate in a
next iteration for the device? Let's say
>> uh how we add uh
>> uh what we will do at the first stages.
>> Well, no, you you have the device right
there, right? And you have the list of
your technical risks. All right.
>> So, have you done any mitigation study
of how can you in the next iteration
let's say fix or partially fix or
resolve any of these risks? So we can
partially fix the risk of for example uh
the error handling part because we can
integrate the hardware and the software
part uh to make uh device every time
test uh self and after it gets an error
it indicate the user there is something
wrong with the device so you can't use
or it need to uh it need calibration uh
before using. So that part we can
eliminate
uh in the future iterations
>> also maybe when it will be medically
validated so doctors will trust the
device and will take some measures to um
do something uh for preventing the
condition to the worsening situation
>> and also you mentioned one of the
existing devices is using statistical
data. Not one of Oh yeah. Uh the smart
scales uh cuz they are based on the
single frequency which cannot um have
the precise information it is working on
the one frequency range. uh and uh they
are using the statistics. For example,
at this gender and age um the normal for
the men is for example 45 uh kilograms
and for that um weight you should have
uh this kind of fat-free mass but our
device uh analyzes um a lot of range of
frequencies and it is more precise and
more personal for that person. So what
I'm think what I'm saying is that
there's a clear evidence that the
statistics brings the value to this
right. So have you thought about adding
the statistics on top of what you have
done? Is it possible to do or have you
thought about it?
>> Uh for this device uh there is no need
for the statistics to be implemented cuz
it it has the ability to measure the
intracellular parts which is the most
important one. the single frequency ones
do not have that ability that is why
they are using the statistics.
>> So that doesn't make any sense to add on
top of what you have statistics. uh
after the getting the outpost when we
use the result part. So five months uh
there we use the statistics of the uh
>> yeah of men and women uh for the same
company uh from their researches to
compare which values are normal for the
healthy people people and for the
unhealthy ones. So we used statistics
there.
Uh well given that the device is
primarily oriented to pet customers we
have some clinical condition.
>> Mhm.
>> In the introduction we mentioned cancer
survivors or post cost post treatment
dehydration realation issues that is
tell to solve. I think uh you should
think about uh we are uh making a
variable product
>> for the patient to carry on to himself
for herself.
uh but that your device parameter
doesn't help.
>> Mhm. you mentioned in the papers I did
books uh between 15 and 30 Celsius
whereas the patient can have up to 40 41
and we should think about it because if
we are looking at the uh immediate
changes in hydration levels
>> which the patient has to pay immediate
attention then uh this has to be taken
in consideration
>> of course of course
>> as uh development advice.
>> Mhm. Thank you very much.
>> Small question.
>> Mhm.
>> Uh probably you mentioned but uh
regarding the analog circuit as probably
most of it is about the PCB as the
device you said is quite should be very
accurate. So the measurement should be
precise you will have area for errors.
Have you done any measurement or do you
have any considerations of having some
of reducing the interference of the
other components on the under circuit or
adding some shielding or simul because
the sensitivity is very important. uh
because this is primary primary the P of
the concept uh we take the into the
consideration uh and the future
development we will add some circuitry
to uh add the accuracy of the overall
system and also uh make the device more
precise uh when it do some measurements
>> and uh it will to
>> to the experts that maybe the offices
say interested to have this monitoring
but when we say this monitoring is mean
that during the time you have measures
and this measures should be somewhere to
understand the dynamics etc. Is there
any interface let's talk about what
docker would like to see
>> and what is the timing in the time scale
how you provide the values
>> chance probably
>> uh as we already mentioned with some
interface we use the lab view
environment uh
>> I know love but love is just for
capturing and providing the
>> but this also can uh we also love you
for logging this data
so It can be used in the further
investigation of the problem for the
monitoring
or
am I understand your question?
>> I think so. But doctor will not accept
it that lot.
>> I understand that if you're collecting
it, capturing it and one day you will
provide it the
>> of course we plan to change the analog
discovery with the high speed high
resolution ADCs. So uh for the further
uh implementation we will use another
software and uh for capturing and data
loading.
>> Okay.
>> Did you tested it on several people or
>> we test it on me
>> only on?
>> Yeah, we're not permitted it. I think
one one thing is that uh maybe you need
to have a supervisor like someone from
uh medical field to understand this feed
but also the the skin thickness the
color of the skin everything will impact
the accuracy of the result that you
have. So that's important you test on
several people and then maybe uh you
need to make changes on the design
amplifier and things like that. So uh if
you do more test again you will get more
accurate uh of course design and result.
>> And if I can just add to that even
calibrate against other
data
>> approaches in other words you can get a
sense of how what your variance is for a
given person compared to alternative
sensitives.
>> Mhm.
>> Well also directions to maybe ground
your work a little more in context. Even
the moisture of the skin can cause the
>> right but instead of qualitative
judgments like that you can actually get
>> so how the variance and and uh you know
what's the standard deviation or some
basic statistics on
>> I did 100 measurements morning noon
night dehydrated hydrated I ate I didn't
eat I don't know whatever all the
factors that could be
Thank you.
>> Thank you.
[applause]