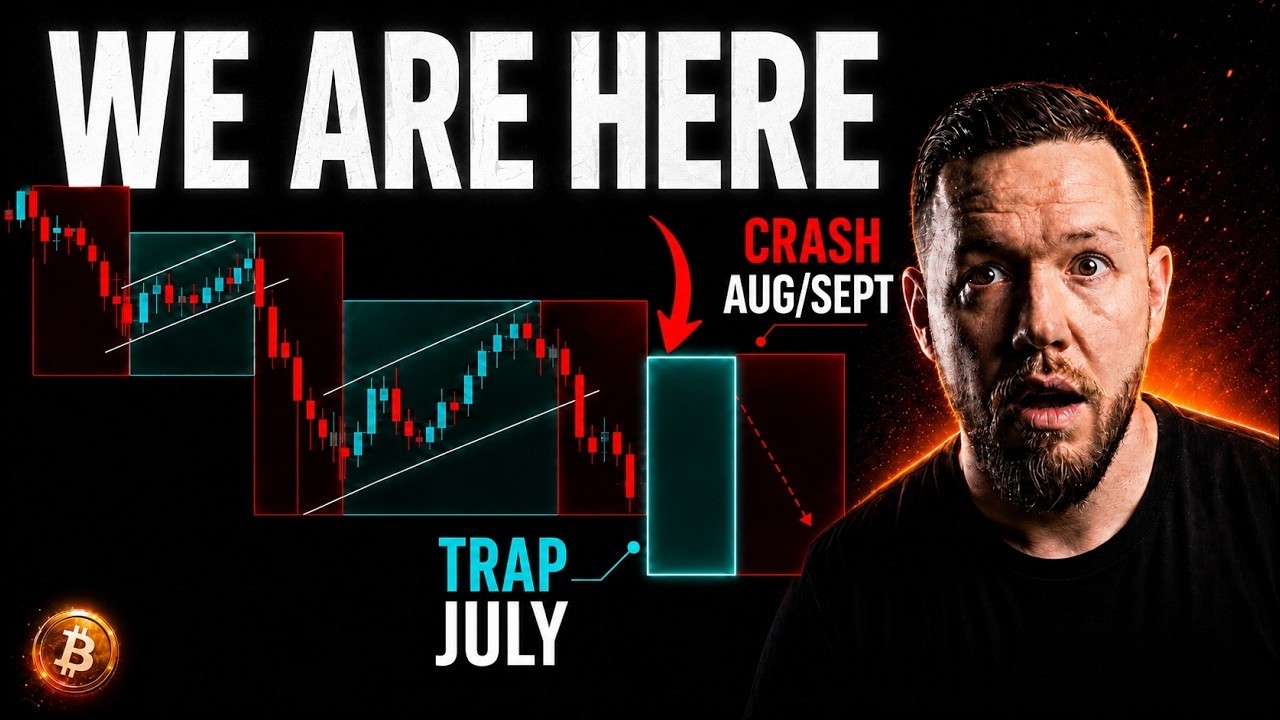
Video summary
The speaker analyzes Bitcoin's market behavior following a prolonged downtrend from January through June, identifying July as a potential "trap" where a relief rally may occur before prices drop again in August and September. He acknowledges that while his previous predictions regarding the timing of crashes in May and June were accurate, he underestimated the specific price levels, noting that the market has not been as severe as historical bear markets from 2018 or 2022 due to diminishing drawdowns. The core argument for a short-term bounce in July is based on technical indicators showing bullish divergence across multiple timeframes, where the Relative Strength Index (RSI) forms higher lows while price continues to make lower lows, signaling that selling pressure is exhausting and a reversal is imminent.
To support this bullish case for a temporary recovery, the speaker cites historical data indicating that when May and June both close in the red, July has historically bounced with an average recovery of around 16% over the last four instances in 2013, 2018, 2021, and 2022. Additionally, he points out that July has consistently been a green month during bear markets since 2015, suggesting a seasonal pattern that favors a price increase this month. However, he balances this optimism with long-term warning signs, specifically highlighting a bearish crossover on the MACD indicator on the weekly chart which has historically preceded significant price declines ranging from 25% to nearly 40% within six months. He also notes that Bitcoin has never bottomed above its realized price line (MVRV), suggesting that while a full crash below this level is not guaranteed, prices may still dip further before finding a true bottom.
Ultimately, the speaker concludes that both perspectives hold validity: there will likely be a relief rally in July driven by technical exhaustion and seasonal trends, but the broader downtrend remains intact with indicators pointing toward lower lows ahead. He emphasizes that predicting the exact price target is difficult compared to identifying the timing of market shifts, so his focus is on recognizing these patterns rather than pinning down specific numbers. While he expects a green July followed by a decline that could test previous support levels near the realized price area, he maintains that the bottom has not yet been reached and advises viewers to play the data and charts carefully as the market navigates this complex transition between short-term relief and long-term correction.
Read the full video transcript
If you've been following me this year,
then May and June have been no
surprises. We have been talking about
this crash trap crash trend ever since
January really. And as we close out May
and June, we're going into July where I
have drawn up as a potential trap
opportunity and potential relief rally
before a lower low in August and
September. So that's pretty much what
we're going to be talking about today.
So on February 8th, I basically spoke
about June, right? You can see I posted
this February 8th on Instagram and June
was a capitulation. Probability of a
major flush 55%. Now I got the timing
correct. I did not get the pricing
correct. So I will call myself out on
that. Now I was pretty close. It was 42
to 55K. I think I I was overconfident on
it being a much rougher um bare market
similar to 2022 and 2018, but you know,
we've it hasn't been as rough and you
know, it shouldn't be with diminishing
draw downs, right? Got the timing right,
didn't get the price right, and that's
kind of the common theme in crypto. Now,
if you weren't following me back in
February when I posted about the uh June
predictions, um I also posted about it
on the 1 of June. So, I told you guys
that the price would drop in May. We
were sitting at $78,000 when I made the
the post on May. Uh we ended up closing
around $71,000. And then I started
speaking about June that it's one of
Bitcoin's weakest months in basically
its its history, right? Just the summer
overall is very very weak for Bitcoin
and crypto overall. I pointed out how
four of the last five Junes closed red
and when May closes red, June has tended
to follow it lower. So with May closing
in red, the prediction and it was was
pretty straightforward. You know,
historically that means that June is
likely going lower at that point. So now
I do believe that it is uh time to
reverse a little bit here and that we're
due for a relief rally, right? Price
doesn't go down in a straight line. You
can see the same pattern play out. We
had 1, two, three, four, five, six,
seven weeks in a row of a crash. 1, two,
three, four, five, six weeks in a row of
a crash here. And now we've had one,
two, three, four, five, six, seven,
eight. eight weeks in a row now of a
crash here. Um it might be seven because
this one is still open, right? This one
might end up green overall. So, we're
due, right? We're we're right at that
threshold where usually um things change
a bit and uh we we it goes from going
straight down to either consolidation or
a small move up like we've seen in these
previous two traps. You can see that
I've been posting the same exact chart
since March when I was calling for that
trap in March and April and it's exactly
what we ended up getting. So you can see
how it was there and then you can pretty
much see how it's developed over time,
right? We had that trap in March that
March and April that we spoke about. So
this was the end of that trap in March,
April and we started talking about May,
June, right? So we were all the way at
the top here. Everybody was saying that
the bare market was over. We were
calling for price to go lower for lower
legs in May and June. If we continue up
higher to the updated ones. Let's see
where's the next one. We got the trap
play out just pretty much as we uh drew
it up and then uh the crash here in May
and June. And you know, skip all the way
to the last update that we put and look
at that now. Now, we went from where we
were way up there when we started this
uh call for May June, crashed all the
way down, and now we're entering the
trap in July. So, let's go ahead and
jump into it. So, let's let's talk about
why the bounce is real for July and for
crypto in July. On all of these charts,
the 4 hour, the 8 hour, the daily, and
the weekly, the RSI has been printing
bullish divergence, right? So let's pull
that up on the chart so you see exactly
what it is that we're talking about. So
on the bottom here we have the RSI. On
the top we have price. So what happens
here and what bullish divergence is is
when RSI goes from a low to a higher
low, right? That's a a change in the
trend really. While the price goes from
a low to a lower low. So there's
divergence, right? these two things are
not uh agreeing with each other and what
happens in these scenarios is that price
eventually reverses and follows momentum
right so the momentum has for for the
move down has been falling off right so
that kind of signals that buyers are uh
well that sellers are getting exhausted
and they can't progress the price it's
harder for them to progress the price
lower basically so we can see this at
the low time frames this is currently
the 4hour time frame. We can also uh go
to the higher time frames. So if we go
to the 8 hour time frame, we're seeing
the same exact thing here. We see price
the RSI had a low here and look at when
we hit this low here. Look at the RSI.
It wasn't even anywhere close. It didn't
even get to oversold at all. So that is
bullish divergence. Um if we go to the
daily, we're going to see the same thing
here. So again, here it is. We have the
low. We have a lower low. We have a low.
We have a higher low. So again, bullish
divergence. Then if you go to the
weekly, and it looks funky here. I don't
know why it it looks so so uh so weird
on here, but it's the same idea, right?
Same idea. We have a uh a low, then a
lower low. However, the RSI on the
weekly is showing a low and a higher
low. So all of those agree, right? We
can see that and that's that's obvious
right now. This is what happens usually
when we have those setups. Price ends up
going higher 71% of the time a month
later. Right? So this same exact
scenario has showed up 17 times in 15
years. Right? So that's not a lot. It's
not a big sample, but
it has shown how often Bitcoin was green
after this same exact setups. This is a
month later, two months later, and 3
months later, right? So, a month later,
71%. Uh, two months later, kind of the
same thing, 71%, and then 3 months
later, you can see that drops down to
59%.
Right? So, that starts dropping back
down. And that's actually kind of plays
into our overall thought of how this uh
bare market plays out, how the next few
months play out because we think over
the next 30 days we'll see that relief
rally and then after that I'm thinking
that we might drop even lower, right?
Cuz this relief rally is going to set up
for a lower low.
So this number is going to end up
dropping even lower probably even this
one to be honest. So now let's continue
here and this is the next uh proof here
the next confirmation which is a red May
red June usually means that July bounces
right so this has happened four out of
four times in 2013 in 2018 2021 and 2022
the average has been about a 16%
recovery um 2026 sets up the fifth time
that this has happeneding So we can see
the numbers here from every time that
this exact same scenario has happened
and it's always played out the same
exact way. So we are running into the
same situation once again. We're
currently down 20% for June and we were
down about 3.4% in May. Right? So this
is setting up for potentially a green
July. And then we can see that in 2022,
you saw the same thing. Look at what
happened in July, 16%. Same thing in
2021. Look what happened in July, 18%.
If we go down to 2018, look what
happened in July, 20%. If we go all the
way down to 2013,
back-toback red months, look what
happened in July. Right? So, we can see
it um very clearly, right? However,
again, it's only four data points,
right? So, you have to take all of this
with a small grain of salt. But that's
why we we are looking for multiple
confirmations, not just one
confirmation. If it was just this, then
eh, you know, it it's not really a big
deal. But because it's so many different
confirmations that we're kind of piling
on top of each other, it makes it it
makes it more significant, right? and it
gives us a higher probability of seeing
a similar scenario. So now the next
thing I want to point out is just July's
overall, right? July's overall during
bare markets have always been green,
right? In 2015, in 2018, and 2022, they
have always been green overall. So in
years where Bitcoin's price has ended up
bottoming,
July has typically been green, but again
two or three uh uh points, right? So
it's not statistically significant.
However, when you put this data with
along with the other data, then it
becomes more significant. Right? So this
has happened three out of three times.
And if you want to see my report for
July, you can comment July in the
comments of this YouTube video and I'll
be more than happy to send you guys the
free PDF that I created that I've been
sending over to people on Instagram um
that talks about everything that we're
covering in this video. So, now that
we've spoken about why I believe we're
going to likely get a relief rally in
July and we're going to be going higher
before we go lower, let's talk about the
reasons why it can go lower, right? So,
I like to look at it from both
perspectives and then kind of make
decisions based on that. So, let's kind
of dive into that on what they're
looking at, what they're paying
attention to, and seeing if there's
there's a reason to believe that, you
know, that could happen as well. So, the
first one is the long-term momentum
rolled over, right? So, this is based on
the MACD. So, if I pull up the MACD here
on my chart, you will see that it had a
bearish cross. So a bearish cross here
when the red line goes over the blue
line and the blue line drops beneath the
red line right that is a bearish cross
and the reason this is important is
because this has happened seven times
across the years right on the weekly
chart and anytime this has happened
Bitcoin's price has gone lower right
from where wherever the price was during
the time of the bearish cross. So that's
why it's something that we need to kind
of keep an eye on. 7 for7 including
every single bare market in 2014. You
can see it happened twice in 2014. Uh
after the first one it went down 39%.
After the second one it went down 64%.
Right? Then we saw it three times in
2018. After the first one dropped 25%.
After the second it dropped 49%. After
the third it dropped 43%.
Right? And then we saw it again in 2022
where it dropped 52%. And we even saw it
in 2021 right before uh it we went into
2022. But the thing to remember is that
at in December of 2021, we were already
in the bare market. We had already
topped, right? So after it signaled in
2021,
um we dropped 40% further. So those are
all kind of important things to note,
right, and to keep in mind uh for the
longer term. This is basically graded
within the next 6 months. So I mean we
can even go all the way back here to
2025 where we actually did get something
like that. So if we go here, we see this
happened August 18th. So let me see
where we were right here. August 18th.
And you can pretty much see since August
18th, we ended up going down basically
across the the next few months. You can
see all the way to January, price went
down 26%. If you go further out, you
know, obviously the further out, the
further down we're going to be. And if
we just go all the way to when we
crossed back,
let me see. We crossed back bullish
right here. So, you know, price would
have been down. Let me see. Was it here?
No, it was this one right here. Price
would have been down about 39 to 37%
depending where you got that signal,
right? So, it's definitely something to
be aware of. However, it's not something
that happens usually right away. You can
see that this is within that the next
six-month period. The next thing is that
Bitcoin has never bottomed above this
line which is the realized price line.
Right? So the average holders break even
line. That's the MVRV line. Currently
that line sits somewhere around 52 or
53,000 and we're currently above that
range right now. And historically
Bitcoin has bottomed below this line
every single time, right? Every single
Hing. Now remember with diminishing
returns we also have diminishing draw
downs. So will price go below that line?
It is possible but it's not guaranteed
because like I told you in the beginning
of this video what's the the easier
thing to try to kind of predict is the
timing aspect of Bitcoin. What's very
very difficult to predict is the pricing
aspect. So this is this one's kind of
you know it's happened four out of four
times. Again it's only four uh scenarios
though. So statistically insignificant
right four data points. And then another
thing to look at is the dip under the
line is shrinking right. So during the
2011 bottom the dip under the line went
58%. In 2015 it went 44%. In 2018 it
went 31%. In 2022 it went 25%. So, I
would imagine that this continues to
play out and um the dip below that line,
if we do get to that line, will be less
than 25%. Maybe around the 15 to 20%
range um would be my expectation, right?
However, again, we don't really know
yet. the price. It's what's the most
difficult to to predict, but this is
something to keep in mind for the longer
term over the next few months, not
specifically for July. So, both columns
are real, right? Both hope and the trap.
I do believe that price is going to go
up in July. And I also do believe that
we're going to go lower um before we
bottom. Right? So, I think both these
camps have a point. I think we're going
to have a relief rally in July and then
I think we're going to go lower and set
a new lower low potentially uh hitting
that uh where past bottoms that realize
price area, right? Um but I'm more I'm
mostly focused on when to buy in, not
exactly at what price to buy in. So kind
of both arguments just kind of play into
exactly what I already believe. Now, I'm
not going to put the exact timing on it
in this video. I already spent like 30
minutes on that in the past video. So,
if you guys are interested in that
video, I'll pull it up for you real
quick here. If this loads, here we go.
You guys can watch this video right here
where I tried to prove the Bitcoin for
your cycle wrong with data. um where I
speak specifically about why timing the
market is easier than trying to time
than trying to predict the price, right?
Uh and it kind of goes back to all that,
you know, what I've been saying
throughout this entire video that I
think, you know, we have a better shot
at predicting price, I'm sorry, at
predicting time than predicting price.
So, July is the bounce, but I don't
believe the bottom is in yet. I'm just
kind of playing the data and playing the
chart, right? So, if we go over here,
you know, we are due for a relief rally.
I believe that happens in July. However,
we're still in a downtrend and there's
still a lot of things pointing for
Bitcoin to go lower. So, I believe that
we also go lower. So, next month, we'll
look back on this and see if it played
out the way that we thought it did or if
it didn't and the reasons why. So, I'll
see you guys on that next