Billboards near a coffee shop making proximity search fast in ClickHouse
Watch on YouTubeVideo summary
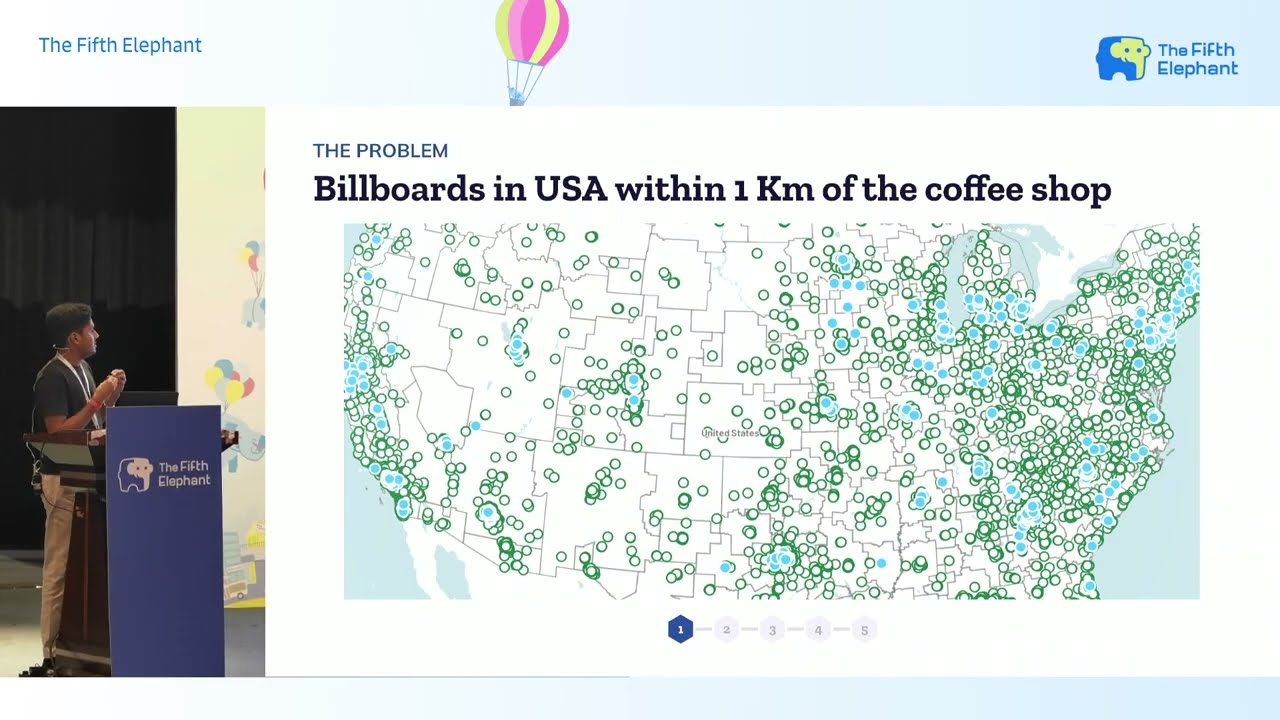
The video presents a production battle story involving Aman, a solution consultant at an out-of-home specialist company that helps brands optimize billboard campaigns. The core challenge was solving a query used by clients like Starbucks to find billboards within one kilometer of their coffee shops; while the existing system could return results for small areas, it suffered from severe latency issues and often failed entirely when scaling up to nationwide searches across 35,000 locations and millions of billboards. The initial brute-force approach became inefficient due to the sheer volume of data pairs generated, leading to response times that sometimes exceeded five minutes or returned no results at all for large-scale queries.
To address these performance bottlenecks, the team evaluated various geospatial indexing techniques designed to filter billions of potential billboard-location pairs down to a manageable number before calculating precise distances. They explored methods like bounding boxes and Geohash but ultimately selected Uber's H3 system because it divides the Earth into equidistant hexagons (with pentagons only used in oceans for geometric closure), ensuring that neighbors remain consistent regardless of zoom level or distance radius. By storing these indices as integers, ClickHouse could perform highly efficient sorting and joining operations on disk-based columnar data using vectorized execution, which drastically reduced the computational overhead compared to traditional row-oriented databases.
The final solution involved a significant architectural shift where both billboard and location datasets were pre-computed with H3 IDs at ingestion time rather than calculating distances on the fly. This allowed ClickHouse to replace expensive distance calculations with fast integer equality joins using its built-in geospatial functions, resulting in a latency improvement of approximately 250 times for complex queries that previously took over five minutes or failed completely. The migration not only resolved the cascading network and query delays caused by multiple service hops but also enabled dynamic scoring based on different brand metrics like reach versus cost, proving that using tools built specifically for analytical processing was essential for handling real-time proximity search at scale.
Read the full video transcript
Guys, uh I am Aman. Uh I work as a
solution consultant with search software
and today we are going to be uh looking
into a production battle story that we
had to solve. It is about a query that
uh used to fail sometimes. It sometimes
uh uh gave results but uh they were they
had very long latency. This is also
about how we reduce that latency and
made it uh return the results, make it
work and make it uh subsecond to seconds
for simpler use cases.
Uh before we jump into the problem
directly, a brief about what we do uh we
are a out ofome specialist. Uh we what
out of home being here is any billboard
that you see while you walk on the road
while you are in the mall all of that is
called as out of home. We help brands
plan buy and measure their out of home
campaigns
uh and thereby uh optimize their value
for money.
A brand comes to us and says, "Show me
the best billboards within 1 kilometer
of Star Blobs coffee shop." Star Blobs
is an example. It's a massive coffee
chain brand in US.
And before jumping into the actual
query, let's start to build it up uh
step by step, let's take a very simpler
example where we look at billboards in
New York within 1 kilometer of the
coffee shops.
Let's assume we have just one Starbucks
shops in New York for the sake of
simplicity and we have hundreds of
billboards in New York. Based on the
query, we draw a circle of 1 kilometer
and any billboard that uh falls into
that radius is basically the billboard
that the brand wants.
Simple, right? We have one place with a
latitude longitude and we have hundreds
of billboards. We calculate geo distance
and whichever distance is less than a
kilometer is basically our target. It is
it's quite simple for one place and
hundreds of billboards. We can draw a
brute force paralyze it. We can get the
query. Let's take a slightly difficult
example where we'll have to do the same
plan. look at the billboards and find
them for New York and California with
the same radius.
And this is how it will look on the map
at two different edges. But we can still
use the last approach, last brute force
approach because it's simple. We may
have hundreds of billboards and hundreds
of places in both of those places. But
we can select New York billboard and
places first. We can do the same brute
force and repeat it again for
California. Pretty simple, right? It
will be relatively costlier, but it's
still doable.
Now, let's talk about the whole of USA.
The Star Blobs brand has 35,000
uh places in whole of US and we have
around 3 million place uh 3 million
billboards in USA.
That's 105 billion pairs.
And we can't just do brute force here
because it won't be efficient at all.
And we also can't use the same approach
we used to calculate the distances in
the last slide because let's say we try
to apply that approach and say we do New
York first, we do California, we do
Ohio, we do all of that. But what about
uh the edge cases? What about the
billboards that are sitting immediately
outside the city border and are still
within the one 1 kilometer radius? We
would miss out on those and it will be
difficult to cater to these edge cases.
The approach that we have is great but
uh we need a more standardized way to do
this.
We have billions of pairs right now with
the approach. We need to find a way to
apply some kind of a cheap filter, some
kind of a predicate push down to make it
to thousands. The similar way we did it
for New York and California and only on
those few thousands we calculate the uh
distance we have billions we convert it
to few thousands and out of those
thousands we calculate distance of every
pair so that it will be faster and still
be accurate.
How do we do this?
Uh there are ways to group points by
areas. Uh one of the examples we've seen
is city, states, zip. We can do all of
that. There are other approaches.
Uh more standardized and simpler ones.
One of that is bounding box. Uh think of
that as putting a square uh with a point
at the center of the square or a
rectangle.
It's a very simpler uh approach to
divide space into parts uh unique parts.
But the problem is it won't be it is not
very correlated or not very similar to
what a circle is. If you look or think
about a circle every point is
equidistance from the center. It's not
the same case with bounding box. So
let's say tomorrow if you want to get
the billboards with 2 km or 3 km or five
for that matter if we try to divide
regions or space with bounding box the
results will be inaccurate and it will
difficult to scale with uh increasing
distance.
A better standardized approach is
geohash. It has its own pros and cons
but it is on the similar lines as
bounding box. There are other ways to
divide uh uh divide space into uh hashes
or unique identifiers. Uh these are
called geospatial indexing techniques. I
have put some of these techniques in the
in the slide that you can uh access from
the has ggeek page. But there's other
one which is the interesting one H3. Uh
it's developed by Uber and a geospatial
index. And the interesting idea they
have is try to cover the whole of earth
with hexagons and pentagons. Think of a
football that you have. Uh we've seen uh
football patches with hexagons and
pentagons. The idea is same here.
Uh for now focus on the right part with
the ID starting with 8144.
If we try to zoom it into that area, we
still have hexagons, but these are of
the same size, but we are into a more
zoomed in mode. This is basically a way
of dividing a single hexagon into
smaller seven children hexagons. H3
calls this as resolution. The higher the
resolution, the finer the area and vice
versa.
The interesting bit about this uh uh and
the reason we discarded the other two
was we wanted uh every neighbor to be
equidistant. So that if we scale if we
increase the distance and the radius it
should not uh it should not contribute
to incorrect or wrong uh wrong results.
As you can see for the ID with in the
ocean 83 4418 if you uh look at the
neighbors that it has everyone will be
equidistance from the center of the
hexagon. This is another uh uh this is
another characteristics that we have and
we went ahead with H3. It offered two
things that mattered uh uh uh for our
use case that mattered the most. One is
we could actually store the index or the
id that you saw as an integer. Making it
integer will help us with uh database
operation. The queries that we have to
run integer uh can be easily sorted can
easily be used as a join key. And the
other part we talked about is the uh
this equidistant hexagons around the
around the center. And there will be uh
there is downside to this which is
boundary approximations. But if we want
to be completely sure we can just
increase the distance of the neighbor.
Instead of assuming our uh k neighbors
as one we can increase it to two just to
be sure to avoid the downsides.
So that is our solution. Let's start
building upon that. We have two data
sets billboards and places. Both of them
get H3 and
this is what the query will look like.
Now we can actually visualize the cheap
filter here on the line number three
with the join. Instead of calculating
the distance, we are doing a cheap
filter which will help us reduce the
total number of uh pairs that we have to
calculate the geo distance on.
And that's what exactly S3 offers.
And this is solution what is going to
what we are going to use in one shape or
form. And this is what actually existed.
The battle story is about why it broke.
The solution actually existed on the
same idea in a different form but it
failed. Before we get into that, there's
a another slight interesting part that
we conveniently missed or I didn't
highlight it in the first because I
wanted you to not think about it which
is the best part. The brand also wanted
to know the best billboards along with 1
kilometer proximity.
To understand what best means here,
let's look at the subset uh columns of
billboard data sets. We have reach and
the cost. Reach is basically how many
people saw the billboard and cost is how
much it costs to advertise on that
billboard.
For a brand, there could be multiple
meanings for what best means. I I would
want to uh focus on how many people I
reach. So I would value reach more and
best in that case would be the best
reach. Billboard with the best reach
which is billboard C. And there could be
a there could be a
brand who values budget. They want to
save money as much as possible. For
them, best billboard would be B. There
would be brands who want both of these
things combined. And this is not a
simple thing for us to identify which is
the best billboard assuming all of the
multiple attributes that we haven't
talked about. It's a difficult job to do
and that requires us or forces us to
have a dynamic index or a dynamic uh
score for the billboard which which has
multiple analytical queries that we are
not going to talk about that today but
this perspective helps us understand the
solution better.
Let's talk about the existing solution.
Now uh on the left uh left bottom you
see proximity service you see and
red is there let's focus uh on that for
now the uh the existing solution that I
was talking about existed in this form
we we used to store uh places uh in
and radius uh in radius we used to
store index lookup this solution or the
service was getting used into a
different product altogether and for
that it worked completely fine. But when
we built a new user interface, a fast
and a
uh a unified AI chat interface, we
decided to use the proximity service as
is and try to solve the question that
brands asked us. Show me the best
billboards within 1 kilometer of coffee
shop. And this is how the solution
turned out to be. As you can see there
are multiple arrows going here and there
which basically means the overall
latency for a user to get that answer
the uh the the payload has to go through
multiple hops for uh us to get the
answer. It will have to go through
proximity service first and then to find
out what best mean it will have to go
through the ranking service again and
then the uh the user will get the
response or an answer. This solution
wasn't very practical and the numbers
also turned out to be the same. On your
X, you have uh distance along with the
size of a brand. Uh brand goes from
small, mid to a dense brand, which is
also called as category. And we when we
done this benchmark against time, this
is what we found. some of the larger
bands and nationwide uh brands weren't
even uh sorry nationwide queries weren't
even supported at all. The worst case
example that we took for USA was not
even returning any responses and the
response that we got for the worst worst
case query was about 513 seconds.
We wanted a solution that uh that was
better than this. And when we debugged
what the problem was there were
basically two root causes and it was a
it was kind of a domino effect. The
queries in itself were very slow and the
end to end was far worse than the query
because the query queries were causing a
cascading effect and also the network
latency was getting impacted.
We wanted a solution that would solve
both of these problem. So we tried to
compare all of our contenders.
We did a spike to find out how all of
our data stores that we had in our stack
would perform against that query. This
is a like to-like comparison. So
whatever solution we talked about in the
first slide, tagging both of the data
sets together and calculating uh the
distance after we match the S3. This
spike outcome is based on that.
As you can see, Click House is
definitely fast here.
Why is it fast though? Uh uh the the
reason why it is fast on a very higher
terms when we are comparing it with
and Radius, right? Click House is
something that was built for analytical
query processing. It's a OLAP database
and neither of the other two were built
for that purpose. The queries that we
are running and uh targeting against
like uh analytical queries for ranking
and geospatial queries are something
that clicks has expertise in and that
was the reason it was fast. The other
thing is everything you store you store
on disk in click house and you only read
the column that you want to and all of
the operations that you're performing
are executed in a ve vectorized SMD
manner and that is the reason it is
fast.
Another thing that it helped us with was
the scaling problem. So when we had to
scale the distance from 1 km to 10 km,
click house offered a capability built
out of the box which helped us scale it
very easily. If you wanted to add a ring
around a kith neighbor, click house did
it very fast which reduced the overall
query times and thereby uh reducing the
overall latency.
And we when we did the final
benchmarkings against click house, this
is what we got around 250x
uh latency improvement. And some of the
queries that weren't getting supported
at all are now supported in this flow
with within uh within a minute. And
that's a huge improvements. We need to
do more but this is the best that we we
could get on a battle story a production
battle story
and this is how the simplified view
looks. Now you have a user interface
calling ranking service. It will score
the billboards and uh on the basis of
that will return the uh best billboards
within the 1 kilometer proximity.
These are the three takeaways that we
got from it. We understood how much and
when to premp compute. Uh the existing
solution based out of and radius
weren't premputing anything at all. It
was calculating everything on the fly.
We learned from that and we decided
we'll premp compute the S3 and tag
existing data at the inest time.
The second one was proximity uh we were
treating proximity as a distance filter
and that was wrong. we could easily
convert it to an equality join by using
geospatial indexing techniques. And the
third one is doing the columnar uh doing
the join in the columnar engine and next
to data solved so many problems and
improved the overall design as well.
When we started thinking of using the
tool uh for which they are built
everything fell into place and the
overall design also got simpler.
Thank you so much. Uh any questions?
Excuse me. Here.
>> Yeah,
>> this one.
>> Yeah. Okay. Yeah.
>> So, uh just curious. Okay. Did you also
try lucine or solar? Okay. Because that
does have a uh support uh
this nearby search and distance. Okay.
Okay. David Smiley had put the module.
Okay. I remember. Okay. And has very
good uh both uh resolving
free tech location data to Jio and then
doing the search also.
>> You mean have uh the
>> No, not HNS blue. Okay. Okay.
>> It it has the HS map.
>> Okay. No, we we haven't tried that. We
uh we started uh with uh we started uh
exploring some of the options but uh
with the benchmarkings and all S3 seemed
the best one uh with uh which had uh the
results that we wanted. So we went ahead
with H3 directly
>> with S3
>> H3 uh this
>> the this is the same one. Is it the same
one again? Oh, no. Okay. I'll have to
check. Okay. On this one.
>> Yeah. Cool.
>> Okay.
>> I had a question. Uh, why do you need
pentagons in here? Like how you
composing them with exagons?
>> Uh, yeah, that's a that's a trivia about
X3. So, they place pentagons in the
ocean so that uh it won't impact the
overall accuracy. So, we don't actually
have to interact with pentagons. What we
get to deal with is just the hexagons.
Cool.