Video summary
The video argues that while software engineering is evolving through agentic coding where AI handles much of the actual writing, the core discipline has shifted from mere coding to high-level architecture, design, and rigorous verification. The speaker distinguishes between "dev mode," where individual agents operate within limited personal contexts, and "prod mode," which requires systems capable of managing an organization's vast, shared data environments. In this production environment, traditional methods fail due to the three Vs of big data—volume, variety, and velocity—making it impossible for Large Language Models to process raw metrics, traces, and logs directly without a structured framework to interpret them.
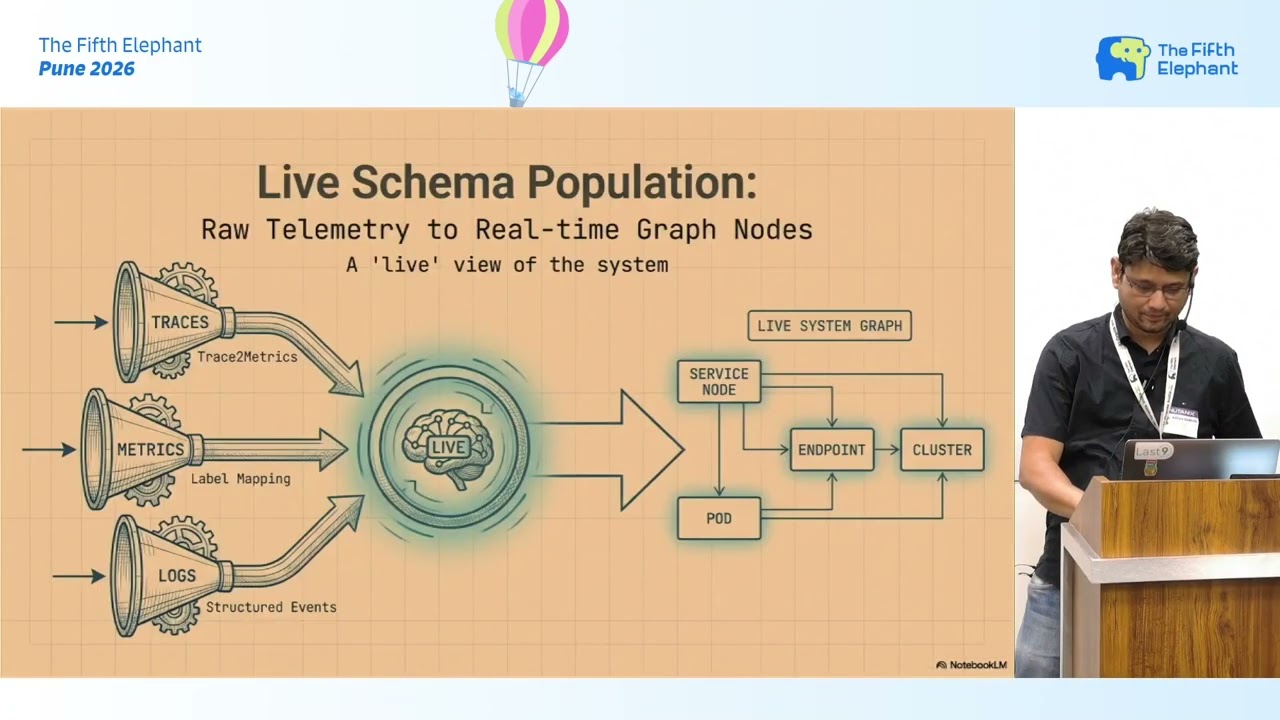
To address these challenges, the presentation introduces knowledge graphs as the essential architectural layer that brings meaning to deluge of telemetry data. The solution involves defining a schema that acts as a template or class definition rather than a static database of instances, allowing the system to dynamically map incoming live data like CPU metrics or log lines to specific nodes and edges. For structured data such as metrics, this mapping is relatively straightforward, whereas unstructured logs require complex pipelines involving drain templating and fuzzy matching algorithms to convert raw text into structured JSON that aligns with the graph's schema. This process ensures that the knowledge graph accurately reflects the organization's infrastructure, including handling synonyms and aliases for different cloud entities.
A primary benefit of this architecture is its ability to act as guardrails for AI agents, preventing them from drawing false correlations or going down irrelevant analytical paths. The speaker illustrates a production incident where an agent without a knowledge graph incorrectly assumed causation between two unrelated error spikes, wasting tokens and time on a dead end. With the knowledge graph in place, the system recognizes that there is no structural link between the two events, allowing the agent to correctly isolate the root cause as insufficient fleet scaling capacity rather than a software bug. Furthermore, the system enhances its utility by attaching temporal notes to nodes and edges, enabling agents to retrieve historical context such as deployment times or previous downtimes during their analysis.
In conclusion, the speaker emphasizes that simple vector databases are insufficient for complex organizational domains and that knowledge graphs are necessary to transition AI operations into reliable production mode. The approach prioritizes a well-defined schema and efficient matching algorithms over using additional LLMs just for data population, keeping the system simple and robust. By integrating these graphs into tools like MCP servers, organizations can provide agents with a grounded understanding of their infrastructure, ensuring that AI-driven insights are accurate, context-aware, and capable of handling the scale and complexity of modern enterprise environments.
Read the full video transcript
[clears throat]
>> Hello everyone.
Um
from
offline like pen and paper scripts to
uh
knowledge graphs again.
Um
So, I'm going to present
uh
something at a conceptual and
architecture level uh right now. Uh
that's what the take home should be.
Um
Recently, I saw a thread on Twitter
X saying basically software engineering
is dead.
Right?
We have all come to this place where
uh we don't open files anymore. We open
our cloud code or whatever it is.
Uh
tell it to fix this particular
pull request, the comments on it, and go
and fix the comments.
Comments are then
uh sorry, the pull request updates are
then commented on by another
uh AI agent which is
uh
which has been trained to do code
reviews.
Then you go through these cycles and
it's uh
while before another human enters the
loop and then
they take it forward to production and
so on.
Uh if you're not
doing so, I believe in a year almost
uh everywhere ubiquitously, that's what
is going to happen anyways. At least at
the coding level.
>> [clears throat]
>> But, I don't believe software
engineering is dead because software
engineering is not coding.
And there's a big difference.
Uh
I think finally thanks to
agentic coding, software engineering is
has finally become what engineering
really is.
Engineering is really about
architecture, design, evaluating
trade-offs,
rigorous
evaluation, verification.
It It used to not really feel right when
you
call the process of building a 3-km
bridge
and the process of publishing a chatbot
on a website as engineering.
Using the same term for both of these.
So, thankfully due to agents, the coding
part is gone.
And finally,
to those who get this reference, I I
start feeling like Geordi on the bridge
of the Enterprise.
For whoever gets that reference, right?
Where they're talking to the computer.
So,
quick anecdote, one of my non-programmer
friends, again like a
a fellow Star Trek
nerd once asked me,
"Is that what you do? Like what Geordi
does, talk to Enterprise?" And I said,
"Yeah, sort of, but when I start to do
that, I run into JSON parse error."
Thankfully that is gone.
Right?
So, we are here, but like I said, it's
not about just building it,
it's also about reliably running it.
And that's where
uh
we don't have good systems yet.
Um because to run it, so till now what's
happening is we are doing this in what I
call the dev mode.
Right? Each one is using agents, Claude,
whatever your personal choices as
individuals, right? They're doing it on
your behalf.
But they are not doing it on the behalf
of the organization yet.
That is what I call as prod mode. And
the difference is the context window in
which these are operating as
as your own minion, so to say. You
control what data it gets, what it
operates on, and what output it gives.
But when you have to do start using it
in the context of the entire
organization
where the data is shared, it's a
completely different problem.
Uh I mean, one way
uh you can think about it is why not
just throw all the data of the
organization
to this agent, right?
Uh
but we've been down this road before in
the world of big data,
right? And seen what happens, the
typical three Vs problem, volume,
variety
variety, and velocity.
Uh
I am going to
talk about this concept of prod mode
primarily in the context of
observability because that's what
uh my product is, and that's the domain
I know. Uh but it equally applies to
other domains which are highly complex,
right? Like for example, the
uh supply chain
that uh was presented
uh in the morning, then I have uh
another I know another company who's
trying to kind of build a digital twin
of the entire uh
uh
su- supply chain plus the ERP and all of
it together, right? Plus the ops,
everything together. So, that's what I
mean by auto mode, but I'll be focusing
on the observability domain. In the
observability domain, you have
huge volumes of data like terabytes,
petabytes a month also. Uh we've seen
that.
Uh you have different types of data. Uh
you have metrics which are from a
consumption point of view they are the
easiest to work with, but managing them
at large scale is a pain. You have
traces
uh
which are slightly more structured. Then
you have logs which uh can be completely
unstructured. You have no uh very
defined structure on them.
Uh and then you have the velocity
problem there. Like
uh
today you have scenarios where your
Kubernetes fleet can go from five nodes
to 1,000 nodes in a minute.
Or 5 minutes. And it's just going to
suddenly change the uh amount of data
that it throws off through that even
that particular time.
Uh also the number of samples that you
get in a particular short window like in
a minute that is completely variable and
that's huge as well, right?
Uh
so obviously LLMs are not going to be
cannot work with
this kind of data directly.
Uh like as the observability platform we
can't just expose this raw data to the
LLMs and expect that they will give you
uh
good results.
>> [clears throat]
>> And that's where knowledge graphs come
into the picture.
Uh
we've seen causal graphs in the morning.
Uh this is somewhat similar. Since
yesterday I've been thinking whether
there's an equivalent, but actually I
don't think there is an equivalent. This
is slightly different. It's although the
structure is the same, I think it's a
different dimension of analysis.
Uh so what you need to do is you need to
take this raw data
and you need to
look at it from this prism of a
knowledge graph.
Right? And only then all that deluge of
data will make sense.
I'll go a bit more detail into the
constructs of this.
Uh
And one thing again I would like to
focus on is
the conceptual and architectural part
rather than the implementation because
frankly if once you have thought about
the architecture and
the design
like I said the coding is simple. For
your domain you'll be able to spin this
up in like a week.
If you know the building blocks and what
challenges you're going to run into.
Uh sorry.
Somehow there is a slide missing.
Okay, anyway. Um
So the first thing is what I call the
schema. Right? So uh
you need to define a schema into which
or on top of which your data is going to
be populated. Here is an example of a
schema which is
uh
it is HTTP services running on virtual
machines talking to some database.
Right? This is a pretty general schema.
Another schema could be
uh HTTP service dumping data into a
Kafka broker where another consumer is
or consumer pool is reading it and then
populating some
uh
OLAP database or something like that. So
these are different types of
architectures and in one organization
you can have multiple of them. Right?
It's not that one organization has uh
just one particular schema. Uh so
here is an example of a schema which
defines the nodes and the edges. Uh the
interesting part which we'll get to a
bit later is the field hints and these
are actually going to be very useful
when you're going to populate
the schema with the live data.
So,
uh the the field hints actually help
uh
help the knowledge graph population
layer to find uh equivalent semantic
meanings in the data that it gets.
So, defining the schema is all well and
good, but the real problem is
in
populating that schema with real data
uh
which has this three Vs problem.
Right? How do you do it?
And we'll look at
cases for logs, metrics, and traces how
we have managed
uh to solve it.
Uh again, like I said, the specific
algorithms that we have used may not map
to your domain, uh but the general
concept should.
Uh out of these, metrics are the easiest
to map because they are the most
Right? A typical structure of a metric
looks like
uh you have the name of a metric, you
have the actual numerical value, and
then you have key value metadata labels.
Uh
any metric sample will have these
properties irrespective of the metric
model that you're
looking at it. You can
uh have like a Prometheus-based model.
Uh different databases and different
domains have uh different models. Some
are exact, some are approximate, and so
on.
Uh but when I am saying that this is the
metric,
think of it as this is what I'm querying
from my metric data source, not
necessarily what is going into the
metric data source.
Because
in different models, the the this can be
different. But the point is that if you
have these metrics coming,
uh then you have very clear parts from
which what maps to what in your domain.
Uh some parts will map to nodes, some
parts will map to edges.
Right? Uh,
and
uh,
like for in in this case,
uh,
the name of the metric, like the request
uh, latency.
This maps to an edge.
Uh, edge between a caller and a called
node, which both can be HTTP services,
for example.
So, uh, remember that I said
you can have multiple schemas in your
domain, and what that means is that when
you're processing metric data,
uh,
it can actually map multiple
uh, or map to multiple schemas.
Uh, what you need to do primarily is
usually
one metric won't map to multiple
schemas.
Right? Although you have multiple
schemas in your organization, the way
metrics are emitted and structured, one
metric doesn't map to multiple schemas.
So, you need to first decide which
schema it is that this metric can map
to.
Right? So, the first stage has to be
where you're
it has to be a very quick and dirty
algorithm,
uh, which just checks whether
there is a good map between the
information in the metric, a good match
between the information in the metric
where
compared to the nodes and the edges of
your schema.
Sorry?
Uh,
so, let's take uh,
CPU metric for Kubernetes.
Right?
Uh,
this will map
to a schema which has, say, a pod
uh, as part of its
uh, well, the schema needs to have a
entity called pods.
And usually in the schema you will have
aliases also which are like a typical
alias for a pod will be a replica.
Right? And the metrics will have these
labels. Either there will be a label
called pod or pod ID or replica or
something like that.
And only if it actually matches uh,
the the labels or the fields in your
metric match to the entities in your
schema, uh, you can call it a match.
There's a chance that multiple also
match so you need some kind of scoring
algorithm. How many match? Do you match
nodes plus edges or are you matching
only nodes?
Right? So, some kind of additive
algorithm where you give a score to
every uh, match on the node as well as
the edge and you take the top one and
you select that one.
But there could be multiple instances of
the same entity. Like you said pod,
right? And then the city. Yes. So, yeah,
yeah. So, the schema is Think of the
schema as a template.
Your schema is not your knowledge graph.
It doesn't have information of the
actual instances. Like for example, a
service endpoint calling another service
is the template. Now, you can have 10
different services in your architecture
multiple calling each other.
Each of them will
uh, sort of get populated as per the
schema into the knowledge graph.
Right? So, what I showed over here was
So, think of it more like a
class.
Class definition rather than instances.
>> [clears throat]
>> Okay. Uh, once you have selected the
schema, then you need to do some more,
uh, concrete matching because even
within the schema you can have entity
like uh,
your your metrics labels can
uh, there can be ambiguity to which node
it matches. Like the first one was a
very dirty algorithm of whether it
matches or not.
Right? The next one has to be more
precise and exact because that is where
you're actually populating and creating
your knowledge graph nodes
and edges.
Right? So,
uh here you need some kind of fuzzy
matching algorithm. Uh it may be
slightly more computationally intensive,
but this is the stage where you have to
get it right. Otherwise, you'll actually
generate incorrect knowledge. So, the
reason I'm in this confusion is that
when you actually build the knowledge
graph
Mhm. it's based on the instances, the
live instances. Yeah. And the schema is
fine. Yeah. But then when you're
collecting the metric, and then you have
to match not only to a specific node
type, but also node instances. Yeah.
So, that's where I ended up saying that
those need to match the specific
instance of that node type.
So, uh I don't know whether this example
shows it.
Yeah.
Okay.
So, over here, let's say in in your uh
schema, you have this thing called as a
host.
Right? And maybe you have some process
running on a host.
In this metric point, you have a label
which gives you the value of the host.
Right? So, if this if you're parsing
this data point to populate the
knowledge graph, this is going to create
a new node
for a new instance. So, prod 01 is going
to become a new node in your knowledge
graph. Similarly, you'll get another
data point for prod 02. That will become
another node in your knowledge graph.
Right? Uh this is And similarly, if
you're on Kubernetes, you will have
pods. You have pod IDs and all of that.
Yeah. Um
just to take the example of the host, uh
maybe in some clouds, it may be called
as instance.
Right? Maybe on some clouds, it may be
called as node.
Or depending on the so all of these
synonyms or aliases
you need to populate those in your
schema definitions
otherwise it's not going to do a good
job of actually matching and
creating and extracting the information
of the knowledge graph from the matrix.
The the second part I haven't explicitly
put it on a slide here and that is
traces.
At least what we do is we just convert
all traces to matrix.
Because we have built the layer to
transform or extract knowledge from
matrix and populate the knowledge graph.
We just reuse that with the additional
step of converting the her traces to
matrix. By the way I'm all of this
there is assumption that you have some
kind of
infrastructure
or platform available on which you can
do all these transformations and run
these pipelines in real time. That is
the part that I'm not covering over here
that is sort of like a
assumption like in in last nine the core
product is the observability product and
we already have this platform which can
do real time processing of pipelines.
All of this is just additional on thing
on top.
The toughest part is the logs and
it's
We haven't had
very great success with logs we in some
scenarios we have got decent success.
But this is the pipeline basically that
we use.
There are two parallel parts to the
pipeline.
We we are using drain templating and
drain matching for this.
What drain templating does is that it is
it keeps looking at every single log
line and it tries to come up with new
templates.
Like it it finds similarities between
different log lines that it sees and
tries to classify those into categories
and extract templates out of it. Right?
Uh
the matching part is relatively easier.
It just takes a template, sees whether
the log line matches, and extracts. So,
think of it like converting a raw
piece of text uh or raw log line from
text into a structured JSON. That's what
the template matching does. But,
template extraction
uh is a slightly more
uh intensive process. It needs state
management, etc. And sometimes the state
can grow pretty huge. So, uh you need to
orchestrate uh all that. But, the point
is that both of them are continuously
running. That once a new template is
discovered, it goes through a pretty
much same algorithm to see whether it
actually matches to any of the schema.
Right? So, the template is extracted,
some standard lines from which the
template was extracted are passed
through that template, a JSON structure
JSON of the line is extracted, and only
if it
uh actually matches any of the existing
schemas in the knowledge graph, then the
template is put in the template store.
Otherwise, we discard the template
because
okay, we found a template, but it has
nothing to do with the knowledge graph.
Right? So, we we don't uh keep it at
all.
And this these two pipelines are
continuously running. We obviously don't
pass all logs that we get through this
because that will be crazy. Like the
volume of logs we get is ridiculous, so
uh what we do is
because we already have a logs product,
we know what queries users are doing,
how frequently they are doing it, what
kind of queries they have saved, what
kind of uh
queries they are running more frequently
and we just take those queries and
periodically run those and pass the
output of that.
And when I say periodically, this
once an hour is enough because
at least for our domain this knowledge
graph is not changing for more than
once an hour. There are some components
like pods which are more ephemeral,
but that's okay. I mean
I would say 95% of our knowledge graph
does not change
so drastically within that hour. So,
running this hour to hour is fine.
How am I doing on time?
Okay.
Uh
so,
here is an example of a knowledge graph
or one section of the knowledge graph
uh
what it would look like after it has
been populated. There are two parts to
this, by the way. Uh
one is so, these are the nodes. These
are the edges runs on, calls, etc.
There's a third part which is you see
the statistics.
Right? These statistics are not part of
the knowledge graph itself.
Right?
This is basically a snapshot from the
product
uh knowledge graph that it had
extracted. At the product level, what we
do is on top of this knowledge graph, we
get the latest metrics and populate the
statistics for those edges and nodes
anyway on top.
Right? As as a default view. So, what
you are seeing is what you get directly
from the product. Uh
these things come real time from the
telemetry data store. But the rest of
it, so imagine this picture without the
numbers, that is the knowledge graph.
With the numbers is taken real time from
the telemetry data store from the
metrics and
superimposed on it. Yeah. Isn't there
one more aspect to the knowledge graph
which is which metrics belong to which
node?
Like tempo API has inserted three
metrics. Those pods don't seem to have
any
Yeah, so but this is directly discovered
from the metrics which have tempo API as
a label. No, that Yeah. But
which which node has which metrics? I I
got how you discovered it. Mhm. But now
these metrics are stored in some
database. Mhm.
>> additional layer which is relating time
series in your database to nodes in your
knowledge graph.
Somewhere you're storing this, right?
Like tempo
>> No, so
Yeah.
And there are three time series which
are continuously streaming
>> [clears throat]
>> Mhm. somewhere. Mhm.
What is relating I mean this is this
won't be some trivial thing. What is
relating a time series to a node in your
graph database? So the node has been
discovered from the time series label
itself.
That I got.
>> Huh? You discovered the node from your
time series label.
Correct. And now that node is stored in
some graph queue. I mean some Yeah,
yeah, yeah. And your time series is
flowing in somewhere.
>> Yeah. When you display to the user,
how do you relate the time series? But
now there are more than one time series
now for that node.
Huh? Right?
Where are you grouping the time We can
talk about this later. Oh, okay, okay.
Got it. So the time series store, you
can very efficiently search with the
label.
Okay, so that is just search. Yeah.
There is no link. There is no No, no,
no. No static link.
Yeah, yeah. So any population of these
statistics is simply a real-time search.
Yeah, and like you can look up labels
for a time series. You can look up time
series for a label. Both are possible.
Uh
>> Okay, uh
uh
Yeah, so
using this process once you have
populated this knowledge graph, now the
question is how do you make this
available? Like till now, you can
imagine that this was some asynchronous
process that was running behind the
scenes creating this knowledge graph
once the schema is defined. The way we
have done it is we have simply made this
knowledge graph available as a tool in
our MCP server.
Right?
Uh MCP servers are extremely powerful.
What I've seen is people don't use them
use all the properties of the MCP
server.
Uh you can add have prompts in there.
You can have uh like real-time values.
You can also query like add our
knowledge graph as your MCP tool itself.
Right? So, in our MCP tool, we have
uh tool
Uh sorry, in our MCP server, we have
tools to not just query knowledge graph,
but also populate knowledge graphs.
And I'll
uh come to why uh that is useful. So,
uh before that, I'll quickly cover a use
case of
like a simple use case where knowledge
graphs really shine. Uh this happened to
us in production. So, one thing we do is
we whatever we build, we dog food it
ourselves because
our engineers are our target users as
well, right? It's a dev tool and we are
all developers. So, we first dog food
everything internally.
Uh there was this case where we saw a
huge uh spike and or rather we didn't
see a spike. Uh we saw uh a high error
rate.
And we just asked the agent, "Okay, do
analysis. What's happening?"
Uh pre-knowledge graph
what it did was there was another
uh spike in 429 error codes.
Which was which happened more or less at
the same time, but it was completely
unrelated.
Right? What the agent did was it got
multiple metrics. It saw that okay,
there is a spike. It assumed correlation
is causation.
And it went down a completely wrong path
of reasoning itself because it does not
it does not just stop at
wrong interpretation of the current
data. It goes and searches for data that
is completely irrelevant in the future.
Like once it got both of these, this
let's say line A was the root cause,
line B was unrelated, it went into a
rabbit hole trying to get more data
about line B and like do deeper analysis
of line B.
And that not just gives you wrong
results, it costs you a lot of tokens
also.
Right? So,
with the knowledge
Basically, this is for example is what
it came up with, right? Spike in 401
errors, etc., etc.
With the knowledge graph in place,
basically now we have guardrails which
say that okay, blue is not related to
green at all.
Both got a spike at the same time. There
is correlation in time, but that does
not imply causation.
And because you have these guardrails
where no knowledge graph had any
connection between blue and green, it
actually did not
pursue this green line.
And it came up with its own
different analysis which is basically
that we didn't have enough headroom. The
customer suddenly sent 5x of traffic and
it took time for our fleet to scale up
and till then the customer got a lot of
errors.
Right? It was a very localized problem
which was actually the
real cause. And with the knowledge graph
in place, it
isolated the problem correctly.
Uh
Yeah, so uh
quick takeaways. I don't have a lot of
time left. Uh
the more complex your domain becomes,
the more you're going to prod mode
versus what's in the domain and scope of
individual, uh you need systems like a
knowledge graph,
uh
a knowledge graph-based memory.
Uh
just simple vector databases are not
enough.
Uh the biggest use we have seen of
knowledge graph is that it acts as
guardrails for your agents not to go off
track.
Like literally guardrails in that sense.
Uh
you have to start with a schema. The
schema is important. Uh you can add more
schemas and make the system dynamic, but
uh
the schema is important and the matching
algorithm between the labels
and the entities in your schema is also
important. When you're developing, it
makes sure that you're getting a very
high hit rate on that. Because a wrong
knowledge graph will actually make
things even worse. It's better not to
have a knowledge graph than a wrong
knowledge graph.
Uh
for us, uh algorithms like uh drain
three, uh
Jaccard similarity match, uh
very basic algorithms. Uh so, these
worked quite well.
Uh we try we have tried and
try to keep it simple, not
uh go into a mode where we are using
another LLM just to match the data and
populate the knowledge graph.
Okay. Uh
one point uh I've not covered in this is
uh because we did that after uh
this was actually the presentation was
done is in the knowledge graph we have
also added temporal notes.
So, what happens is as part of the
inference and it is part of the MCP
server. So, whenever agent
comes up with some inference or some
kind of analysis, it can attach it as a
note with a time range to any node or
edge in the knowledge graph
for further reference.
And when you And the knowledge graph
search tool, whenever it searches that
particular node or edge, it also gets a
historical list of all the nodes
associated with any of the edges
attached to that node.
So, that
and these notes are extremely useful.
For example, there was a downtime at
this time, a deployment happened at this
time, and so on.
These notes
are making a big difference compared to
not having them.
So, that's also something you can look
at.
Okay, sorry. Thank you.
Uh you can just log in, try it out. Uh
it's the agentic flow is under alpha, so
you'll have to sign kind of send a
support request after you send the sign
up to
uh
get that enabled.
Thank you, Andy.
Do we have time for questions?
Does anyone have questions?
No.