Video summary
The presentation addresses the "quadruple challenge" facing modern agriculture: sustainably boosting production for a growing global population, adapting to increasingly extreme climate events, mitigating greenhouse gas emissions such as methane and nitrous oxide from fertilizers, and maintaining economic viability. Central to this discussion is the Agricultural Model Intercomparison and Improvement Project (AgMIP), an initiative designed to bridge the gap between agricultural modeling and advanced climate science efforts like CMIP by coordinating over 1200 researchers across global, regional, and field scales. A critical focus of these collaborative teams is avoiding the "lamp post problem," where scientists rely too heavily on well-understood drivers like average temperature and precipitation while neglecting complex phenomena such as fire, hail, or river flooding that significantly impact crop yields.
To accurately predict future outcomes, models must move beyond empirical approaches to develop a mechanistic understanding of how short-term weather variability differs from long-term climate shifts, recognizing for instance that reductions in frost do not necessarily compensate for the expansion of extreme heat zones. Recent findings indicate that models with high equilibrium climate sensitivity produce more pessimistic yield loss scenarios because they project faster warming levels even at lower carbon dioxide concentrations. Furthermore, while crop models generally perform well under average conditions, they struggle to capture long-term drying trends and the intricate interactions between drought stress and CO2 fertilization effects, necessitating a deeper integration of economic modeling that accounts for how farmers adapt through yield changes, shifting production areas, and land-use expansion which subsequently influences trade prices and ecosystems.
Beyond biophysical constraints, the discussion highlights significant challenges in tracking soil nutrient availability over time; while monitoring nitrogen, phosphorus, and potassium is essential for grain quality, maintaining long-term soil health remains difficult to model accurately. Grain quality management also varies by crop type, with cereal crops generally better managed regarding CO2 concentrations compared to plantation crops like fruits and grapes where quality often takes precedence over quantity. Socioeconomic factors driving shifts in what farmers grow—such as switching from rice to maize due to price fluctuations or irrigation enabling new growing seasons—are assessed using farm household models that evaluate economic net returns, revealing how these decisions are deeply intertwined with broader market dynamics rather than just agronomic suitability.
Effective adaptation strategies often require a multi-element approach known as "adaptation packages," which combine shifting cropping systems, adopting drought-resistant varieties, adjusting fertilizer regimes and planting dates, or securing crop insurance to address various extremes within the economic system. Although this comprehensive method can blur the lines between specific interventions, it aims to provide robust solutions for complex scenarios where single measures are insufficient; however, initiatives like companion cropping face challenges due to limited investment compared to climate-focused projects. The presentation concludes by emphasizing the urgent need to rebalance attention and funding toward developing better models that can handle these nuanced agricultural interventions while continuing to co-develop specific vulnerability targets with stakeholders rather than relying on generic adaptations, acknowledging remaining gaps in modeling pests, diseases, soil moisture dynamics, and farmer behavioral changes regarding crop selection before transitioning to further discussions.
Read the full video transcript
from the NASA Goddard Institute for
space studies in New York and this
session today is going to be on
agricultural impacts and the climate
information that we need
um and we have three speakers today I'm
going to get started with with an
overview and and bring in some of our
approaches from ipcc and agnip and then
we're going to hear from Benjamin Sultan
uh and Edmund Toten later in the uh in
the hour and a half we have or hour and
45 minutes that we have here so I think
I'm just going to get going on this uh
and and uh I the we'll probably have
questions
um depending on the time frame we're
hoping to have questions at the very end
um and then we'll see how we're doing in
the in the transitions between if there
are quick clarifications
um
all right so I wanted to start by
talking about what I call the quadruple
challenge for agriculture and this is
that the world is asking the
agricultural sector to sustainably
increase production to provide healthy
food for growing and developing
populations it's not just about feeding
who we have today it's it's about
feeding the growing populations and
recognizing that as countries develop
they're often asking for different types
and quantities of food
there's also new kind of efforts for
nutrition that are changing the types of
food that are recommended even in the
richest places in the world
um we also are asking the agricultural
sector to adapt to climate change and
ongoing climate extremes which are
already upon us while also mitigating
emissions from agricultural lands most
importantly from livestock and from Rice
uh methane as well as uh you know the
the overuse of fertilizer in some places
um and then also none of this will be
possible if we can't maintain some kind
of financial incentive for agriculture
uh that that supports so many uh
Regional economies so any one of these
challenges is substantial and when you
put all four together at the same time
uh you you understand the challenge that
that faces the food sector
so what I'm going to talk about today is
uh is an inventory of agricultural
responses to climatic impact drivers
um as well as that term climatic impact
drivers cids being a core element of
approaches that we take within the
agricultural model into comparison and
Improvement project or agnip which I'll
introduce uh then I'm going to talk
about how we build scenarios of future
agricultural systems and wrap it up with
some key priorities for agricultural
risk information development
so this is a table that you've seen
already several times this week where we
have taken the the inventory of climatic
impact drivers that we developed within
the ipcc working group one uh you can
see this in in chapter 12 table 12.2 and
uh just as a quick reminder these are
the major types of climate conditions
that we know Drive responses in the
things that we care about and there's a
whole table here with many rows but I
pulled out the crop system row because
this is where I'm going to focus much of
my attention today and I'll also note
later in the table there is a a row for
agricultural lands which is a slightly
different
different row so this one is really
about when there are crops in the field
what affects them whereas agricultural
lands are questions around you know
large scale where do we grow Agriculture
and is it is it uh viable so for example
you'll notice uh the most obvious
example of this is right here where
plants that are in the field can get
affected by uh coastal flooding but
usually if the relative sea level has
already risen and taken over your field
you're not likely to plant so that is
more of a lands issue than a specific
crop that might be in the field but the
idea behind this table is that where you
see darker colors are places where we
saw in the literature that people are
using this climate information to
determine some kind of a response
usually it's because they've observed it
um and uh and they have some ability to
think about the projections or or how we
go forward so you'll notice that there
are many many different climatic impact
drivers that affect agriculture and
almost every single one has a unique
pathway by which the biophysical
processes are affected and unique types
of metrics and indices that we have to
provide as climate scientists to to
enable that so I wanted to go through
some of these
um and talk about how we do it but
before I do that I'm going to give some
some context of where I'm coming from so
um I am the science coordinator and the
climate team leader for the agricultural
model intercomparation Improvement
project this is agnip uh I'll stop
saying the full name and just start
saying from now on
um but agnip is designed very
specifically and intentionally to be a
lot like cmap the coupled model engine
comparison project that we use for
climate models we want to do the same
thing for agriculture so we we saw that
the agricultural modeling field was
decade leads behind the climate modeling
field when it came to systematic inner
comparison Community engagement and and
collaborations across modeling groups so
that we could have direct ways of
figuring out what we can and can't model
and how we can prioritize and Achieve
model improvements so this is our we
call this our flower diagram that shows
major areas in which we have model Edge
comparison projects and every single
petal of this is a a major uh kind of
category and then each row is a specific
set of protocol based activities using
multiple models and multiple
institutions in multiple countries and I
could talk all day about what this looks
like
um but what I I do want to say is since
we launched in 2010 this this diagram
has gotten more and more complete we're
now actually going off the bottom of the
screen here that you know Vietnam has is
only half on here unfortunately
um but you know we're adding more
regions we're also working on a bunch of
different scales so I'm just going to
call out the largest categories here
let's see if I can get the uh the
pointer to water so we work first of all
on the global scale so we try to take
everything together and build
assessments of global economics and food
prices and food trade
um but on the opposite side we go all
the way down to the experiment model
interface where we have entire projects
based on the crop water
evapotranspiration so the fundamental
physical processes in one field trying
to get that right on the flex Towers Etc
um we work not only on the global scale
but we work in the regional areas where
we try to put all of our elements
together and make the best support for
adaptation and risk management planning
we also have uh coordinated efforts to
to make large-scale gridded bottles of
crops uh and while we're doing all of
this of course we're building up data
and tools looking at interactions with
things like water resources and
livestock and we have all kinds of
cross-cutting themes and I'll talk about
them in a little while but maybe what
agnip is most famous for is these crop
model intercomparisons where we have
teams that are fundamentally focused on
each species so we have a wheat team
that has compared more than 40 different
wheat models and you can see the other
ones here I don't think anybody stands
up to the wheat team but maze has more
than 20 models rice has about 18 and you
can see the the diversity of what we do
all right yeah and then overall agnip is
this community we got more than 1200
people around the world and it really is
designed to be interdisciplinary
so I have to acknowledge first that we
are super proud in the agma community
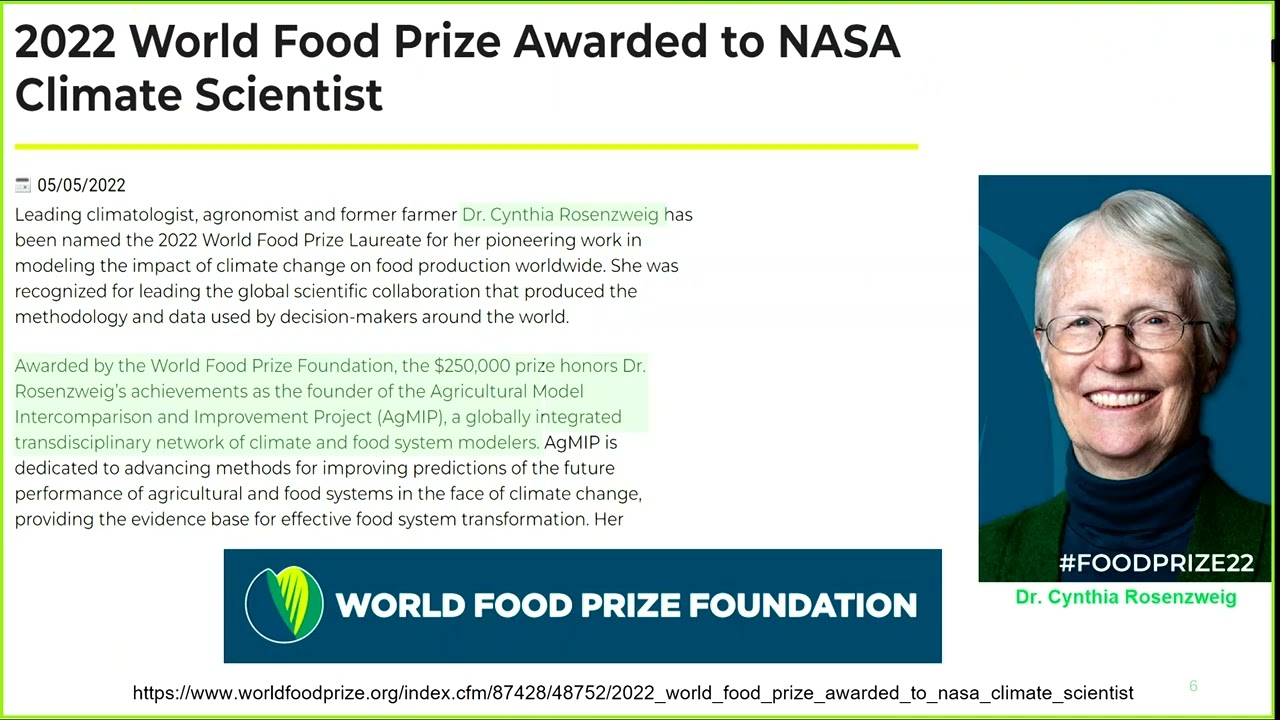
that uh one of the aggregate Founders
Cynthia Rosen swag was named the 2022
World food Prize winner uh for those who
don't know this is like the Nobel Prize
for food systems and uh the reason I
especially wanted to thank Cynthia for
this is that Cynthia has actually
donated a portion of this prize to this
Workshop to help some of you come here
um this is the type of thing Cynthia
rather than taking this money and going
on a boat trip somewhere she has
funneled it back into agnip and is now
funding conferences and workshops uh
even in small pieces uh to the best that
she can
all right so the way that we think about
agmap is really that we can't understand
and prepare for the big food system
challenges I mentioned unless we
recognize the complexity of the food
system so here's one representation of
the food system uh you can see there's
lots of details but the main thing to
recognize is that it is not just what
happens in climate
um we have to understand the fundamental
biology and how it interacts with
climate but we also have to recognize
that food interacts with a very Dynamic
economic system and a political system
that can interfere or enable uh and and
that's something that we have to
recognize so there are all kinds of
things that we've done in agnip to kind
of build up our understanding of each
element and the way they interact but if
we kind of Step Up a big Pace backwards
we can re we can talk about how the
agricultural models fundamentally are
trying to understand how the world
responds when there are shifts in the
genotype of seeds so that's like the
genetics and and the seed selection the
government itself that's where climate
change comes in management of what
farmers do like that includes many
adaptation types and then value change
because it's not just what happens on
the field after you harvest and move
past the farm gate there is a whole
chain of production could be just local
markets and it could also be going
through processing plants and shipped
around the world
so we talk a lot about G by E by m
that's a little bit Insider speak but
this is the way that the genetics and
the environment and the management
interact and then I've for the first
time in this presentation added the
value chains uh on top of that
so one way we think about uh
agricultural modeling is that of course
we're fundamentally trying to represent
hazards and disasters uh this means that
it's not just a climate change it's all
time scales
um but we're going to build up a figure
here and the first thing to note is that
we fundamentally have to understand how
CL how crops and the agricultural system
respond to things like extremes and
temperature both on the hot and the cold
side rainfall extremes from droughts to
floods air pollution pests and diseases
Cyclones and extreme storms and then
this plus sign in here is doing a lot of
work that covers the rest of that CID
table we know there's a lot more
um but of course if we can fundamentally
model these responses we can follow this
time scale at the bottom here we can
monitor during a season up to present
day represented by this this line and we
can forecast with our climate models and
our our crop models or our seasonal
forecast weather models
um and then of course we're very
fundamentally interested in a lead time
because that tells us how we can react
and what types of interventions we can
be reactive as we see disasters
unfolding of course we can take these
same models and go backwards in time and
this gives us understanding as we we
fundamentally look at things like
detection and attribution and counter
factual management which is another way
of saying if we had known that that
drought was coming could we have done
something differently and we can model
that because models allow us to go
beyond the observed experience and test
out different interventions so between
these two things we can you we can
develop understanding and you'll notice
of course that it also points to certain
types of climate information so we might
want to look at historical observations
retrospective analyzes data assimilation
type systems
of course if we go far enough on this
timeline here we're really not
forecasting anymore there's this Wiggly
area and then we're really talking about
projections this is because of course
the future depends not just on the
initial conditions of what we see today
but on decisions that we make as a as a
general society around climate change
the way that the markets are shifting
policies socioeconomic change and larger
questions of environmental
sustainability so once we're out here we
need scenarios so that we can project
and understand and this of course is
super valuable because we have to get to
this proactive set of interventions that
recognize non-stationarity and emerging
challenges it's not just the same of as
the past we need to get to the Future
so uh one of our our more famous set of
projections are these Global yield
projections that we've made
um these were done in in association
with the easy MIP project the
intersectoral impacts model engine
comparison project uh where agnip runs
the agricultural sector and what you see
here in the bottom left are Maize yield
projections and in the upper right are
wheat yield projections and you'll see
that they're going largely in different
directions The Maze yield is getting
orange that means lowered yield and the
the wheat is in some places getting
green so if we want to understand what's
Happening Here we need to figure out the
fundamental responses and if I can pause
it back
um
uh it looks like I'm not gonna be able
to
hold on a second
what I gotta I have to do is I have to
play it again so I'm going to talk
through just a couple things that's
happening so while you're while you're
watching this you'll notice that that
the maze yield is particularly uh
detrimentally affected in the the
tropical region so places that are
already near the hot thresholds are
being most strongly affected wheat
yields you'll see in in some places
especially where rainfall is increasing
and where it's currently cool a little
bit more temperature can actually be
helpful and then of course we have the
carbon dioxide effect which is generally
going up and helping many agricultural
regions but notice that there are
exceptions parts of Southern Canada
Pakistan parts of India Bangladesh these
places are also being negatively
affected as well as Mexico and Southern
U.S so again there's a little bit more
danger in the tropical regions but as a
cool season cool climate zone crop wheat
is faring better than mace so this is
also very strong message coming out of
the Agricultural sector which is that
you can't talk about crops in general
you have to talk about systems and
regions
so this figure
um or this study was actually featured
in the synthesis report figure SPM 3C
which is the first time that we've ever
had anything like an impact map in the
synthesis report summary for policy
maker so this is actually a really big
step that we had this map you've already
seen some of the other ones on
ecosystems and human health uh there's a
figure Below on Fisheries which I won't
get to but this was a big battle in the
synthesis report approval session to get
these figures through but for the first
time we do have these types of
projections
um that that we have not just the
projections but you'll see the hatching
that's the uncertainty across the models
both climate and crop
um and and there's a lot we can do with
this
yes
the health one no that so there there
was a different battle the original
figures that we had had both Maize and
wheat and we were trying to present just
like I did before you know there's some
positive some negative and and the
system is complicated but in the end
there was just too many figures so they
said we can only have one and when we
put the hatch marks when you put the
uncertainty on the wheat map it was much
more uncertain which reflects the the
wheat team's understanding as well so we
decided it would be easier to have one
one row here and and this this was
approved pretty quickly actually the
health was a whole other battle it took
much much longer
all right so coming back to this uh this
table of of cids I wanted to focus on
kind of how we understand and respond to
these
um so the first thing I wanted to say is
that we are at risk as a community of
What's called the lamp post problem all
right and and there's a figure a cartoon
here that will help you understand it
but the idea behind this is some some
drunk person walks out of a bar and they
can't find their car keys and they're
looking for their car keys and they're
looking for them underneath this lamp
post and the guy says oh did you lose
your keys you know somewhere around here
and and he said no no I probably lost
them over here but there's light here I
can see so I'm looking for my keys over
here where there's light and of course
you're never going to find your keys
over here if you lost them over there
but it's just so appealing where there's
light and I think we sometimes have the
same issue with with some of our impacts
modeling which is that we know how to do
certain things well so we focus on the
things that we know well and there's
this whole other dark space over here
that we have to at least recognize we
have we have to avoid being this this
person
um
so when we look at this table we can
start to directly assess if we are doing
a good job of representing different
pieces of it so here are a couple that
I'm calling out the mean air temperature
which we might use metrics like Growing
Degree Days that's that would be a CID
index for those who don't know Growing
Degree Days basically counts every
degree above some baseline temperature
so if your Baseline temperature is 10
degrees Celsius and you have a day that
is 13 degrees Celsius you have three
Growing Degree Days three points above
that above that limit and crops actually
grow according to you know a calculation
and accumulation of Growing Degree Days
it's a very strong metric for crops
that's what determines their growth
stages and it determines whether we get
to that Harvest and have had enough time
in the field uh absorbing sunlight and
making you know the the carbohydrates
that we need for our grains so uh mean
air temperature we do a very good job
with so I've put a green star that's
something crop models do well mean
precipitation we also do quite well
that's a fundamental part of of all crop
models aridity we do a little bit better
but a lot of our crop models don't
capture the long-term Trend and drying
out of certain regions of the world
sometimes we assume that crops are
planted in a saturated field when that's
not always the case so those types of
things we can improve and you'll also
notice over here that I have atmospheric
CO2 at the surface and this was a CID
that we really had to fight for in
chapter 12 because a lot of people
didn't realize carbon dioxide they think
of as the cause of climate change but it
is itself a direct impact on agriculture
and you can't really model the future of
Agriculture unless you have CO2 so it's
definitely an element of our human
influence on the climate system that is
affecting uh something that we care
about so it deserves to be here and I'll
show some examples of how we're
understanding this this is a picture
over here of a field trial oil in
Arizona
where we had a whole field of of Wheat
and we were able to use heat lamps in
one part of the field to synthesize
warmer conditions so we had the exact
same weather the exact same
precipitation the winds you know all of
that stuff is the same but we have extra
heat in this one part of the field and
when we actually did those experiments
we got observations here in red and as
we increase seasonal mean temperature we
get a drop in the grain yield and you
can see this pattern and the gray and
green here are our crop models that have
done a pretty good job overall of
representing that drop off and there are
things to still figure out there's some
some error bars the line is not a
perfect one-to-one match but this is the
type of thing we're doing in agnep we're
trying to find these field experiments
and make the models accurate
yes
that field
um I would say that's I mean so there
were multiple you can see there's
multiple stations there's other ones in
the background like over here
um but each one is maybe 10 meters wide
something like that I don't know
uh no there I mean there were
um many of these so uh they were running
in different fields kind of all around
in that area
um but yeah there's there's some really
fascinating stuff I'm not even going to
show the free air carbon enrichment but
they have basically a big ring and when
the wind blows from this direction they
they release carbon dioxide into that
Windstream so it blows over the field
and then the wind shifts to over here
and now they release the carbon dioxide
from here and they're trying to maintain
a higher CO2 in the field
um all right so
uh I already mentioned uh the kind of
mean air temperature and CO2 as as
impacts but of course as the climate is
changing both of these things are are
changing so this is new not yet
published uh results
um but it actually calls a little bit of
question on the global warming level
approach which has taken hold and work
in group one and working group three uh
it's very convenient from a large-scale
policy perspective to say that you know
in general a two degree world is the
same whether we get there quickly
whether we get there late uh and even
the climate models you know the ones
that are most sensitive to climate and
the ones that are least sensitive to
climate still basically say the two
degree world is about the same and here
is one reason that it's not which is
that if you actually take different
climate models represented as the
different colors here and the different
shapes being different scenario Pathways
when you get to this two degree world
you have a very large range of carbon
dioxide concentrations that are
associated with that two degree world
more than 150 PPM difference all right
by the time you get out to a four degree
World
um the range that you see here is uh
about 200 and then even there you can be
deceived because not all of the climate
models are sensitive enough to get to
four degrees so the true distribution is
even larger the last level that all of
the climate models get to is here the
Three Degree world and you can see it
goes from 550 up to about 750 or 800 so
there's very large ranges in CO2 which
we know will have an impact on crops
um
so we actually can run these through our
our crop models and unsurprisingly the
model the UK esm which is the most
sensitive to climate change that is the
model that reaches higher global warming
levels fastest so when it gets there the
CO2 is not as high as other models which
need more CO2 concentration to reach
those higher levels so that UK esm model
gets to the high global warming levels
earlier with a higher with a lower CO2
and that is a very bad combination for
crops because now it's the same
temperature but the CO2 is lower and
that means unsurprisingly down here that
is the most pessimistic model so the the
yield losses this being a maze yield
loss for the most uh the models with the
highest equilibrium climate sensitivity
so that the strongest response to
climate change
those models are the most pessimistic
which means I can draw a direct line
from pessimistic crop projections to the
equilibrium climate Center sensitivity
of the climate models so this is work
that that's uh hopefully coming out soon
but something that we really need to
Grapple with
all right so when we're looking at
extreme heat the other thing that we we
are trying to do is we have to recognize
that there are it's not one category
there are many thresholds within extreme
heat as a category so we had this figure
in in chapter 12 in our our FAQ section
that is just a simple way of thinking
about you know there is a a set of
temperatures represent on the x-axis
here
um where growth is not really limited by
temperature it basically is growing
happily but as you get across a critical
temperature threshold uh you seem you
often see this kind of Step change where
now you're getting reduced growth so
it's a little bit too warm the plant's
not quite happy and growth goes down but
then you can reach a second threshold a
limiting temperature threshold after
which the crop can rapidly drop off and
fail so we need to spend time in the
agricultural Community to identify these
thresholds and make sure we understand
how close to those limits we are and
what types of adaptations we might be
able to do for example a genetic
adaptation could literally move this
threshold to the right give us more
space before we start to lose our yields
um another thing that I just can't
resist but showing is a result that we
got back in 2016
um where we compared
um I'm gonna have to talk through this
this is uh many different models that
were run in the in the agnip wheat team
and on the bottom axis we have looked at
the year by year variation of that crop
model's response to climate and we have
made a correlation between the yield and
the average temperature so as you'd
expect most of these models have a
negative correlation when it's hot the
yield is low when it's a little bit
cooler the yield does better right so
that negative correlation makes sense
but then we asked the question of are
the models that are more sensitive to
that seasonal variation also more
sensitive to climate change so when you
increase the mean temperature do the the
models that are reactive to climate or
to temperature do they drop more and the
general pattern is pretty consistent
this diagonal line here means uh this
was a very warm sensitivity test but
very easy to see the models that
responded most to seasonal temperature
also responded the most to climate
um so that General pattern makes sense
but you'll also notice that the models
do not cross the zero line at this
Middle Point and what that means is that
even the models that did not respond to
the seasonal temperature variation show
a climate change response and the reason
for that is there is a fundamental
difference between a warm season and an
overall warmer climate all right so you
may have remembered that warm year that
happened in your country it may have
been a two-week very hot spell that came
through and made the temperature for the
whole season warm
plants respond very differently to a
two-week Heat Wave than they do to every
single day being a little bit warmer
every single day being a little bit
faster in your growth stages so this gap
between the origin and all of these
Crossing Lines for each of these
sensitivity experiments the blue one
being a cooling experiment that's why
the line is different but that Gap
really shows that there is a fundamental
difference between seasonal and and
climate type changes which also calls
into question some of these empirical
approaches where you fit your climate
response to recent seasons and then just
assume that that applies to climate
change so we have to be careful there
and this points us towards mechanistic
models
I'll also just do a quick look at uh
when we look at Frost versus Heat there
is a temptation to think that heat might
be expanding but at least Frost is
moving away that means that we don't
have to worry so much about Frost
damages now we worry about heat damages
maybe that's a good trade-off but in
reality what we're seeing at least in
North America is all of these red areas
are places where extreme heat is going
to reach either by 2050 or by 2100 so
you can see this dramatic expansion
including many agricultural zones I'm
looking at Jeff here because there's a
lot of Michigan in this chart the heat
is expanding up the mountains and up
north the Frost is really only going
away in purple here in a few smaller
places that are not even as
agriculturally profound so part of this
is that the heat is coming but the frost
is still variable enough that you still
get frosts even in many of the places
with heat which means now we have a
middle season limit as well as an end of
season limit
um we did of course in in uh our ipcc
work split hydrological drought and
agricultural drought
um hydrological drought I think of as
the water resources for irrigation and
your surface ponds or anything like that
uh whereas the Agricultural and
ecological drought is really about your
availability of soil moisture and I'll
just note that there are many many
indices here that we could look at uh
We've we've looked in particular at spei
but there are many that you can examine
in general I would say that the models
do pretty well with that
um we are our crop models have
Irrigation in it but oftentimes the
models assume that irrigation is
available so we need to connect it more
with the Water Resource models uh so
that we can have a better connect a
better set of responses
um one other thing that I have to
mention is that's drought and CO2
actually interact very strongly in our
crop models an example of this is we we
have experiments with that elevated CO2
done experimentally and this is maize
yields and during a wet year
the the y-axis here is the response to
climate change during I'm sorry is the
response to CO2 so in a wet year there's
a very low response
whether it's irrigated or rain fed but
in a dry year the irrigated response is
not very strong whereas the rain fed
response is very large all right another
way of of understanding this is that
when conditions are dry
the crops close their stomata they make
it so that there is less exchange with
the environment because they want to
hold on to that moisture that also means
that when they close those stomata they
are not taking in CO2 in the in the same
way
um however when there's a high CO2
environment even when they're holding on
to that water they can still get enough
CO2 so the carbon dioxide is especially
beneficial during drought years and we
can see that in the models and in the
experiments
all right uh last couple ones I'm
looking at of course we have River flood
and pluvial flood pluvial flood is like
heavy heavy precipitation events the
models do a pretty good job with pluvial
flood but with River flood many of our
models don't even know what is happening
elsewhere in the Basin they are
effectively single column models so if
there's a flood coming down the
Mississippi River that site you have in
in Missouri does not know about that
flood uh so we we are often missing that
and in the United States the worst year
for us is almost always 1993. big flood
events huge losses of crops and the
models often miss it
um
all right so here's the summary of all
of this I've I've skipped a couple of
them but I wanted to kind of provide
this
um and and talk about you know in green
here are the are the cids that I think
our models do a pretty good job of
responding to Blue are the ones where
some of the models include a response or
maybe there's more work that we think we
can do
um the darker blue here are things that
we think we can add in a soft coupling
so for example if you give me maps of
coastal areas that are flooding uh we
can we can change our you know we can
add that that additional factor to our
results but you'll notice that there are
several columns here where we have
pretty much no response at all that's
things like fire affecting agricultural
zones hail heavy storms some of these
things we don't do as well with
um and then I've put this little red dot
on some places just to call out
explicitly things like water logging uh
impacts on agricultural laborers Health
pests and diseases and sequential
extremes these are all areas of active
research and I should also note that
when we're providing climate information
we have to be careful because we don't
always provide changes in every one of
these cids so if you have used an
approach where the only difference
between the Baseline climate and the
future climate is the average
temperature well you're not going to see
changes in rainfall you're not going to
see changes in uh the extreme
characteristics for example
all right um we're doing a lot of work
in agmap right now to build machine
learning models and this is a very
complicated figure
um but the bottom line of it is that
we've taken the top 16 maze producing
countries of the world so the number one
producers the US number two is China
gone across this list and we've taken
many many different climate features
including uh cool temperatures freezing
temperatures hot temperatures at two
different levels the average temperature
the total rainfall and then some drought
characteristics like consecutive dry
days or the number of rainy days and
then we've taken all of our crop models
as an additional uh set of information
and we've asked the machine learning
model to create the best possible
predictor for each of these countries
National yields and when you see a big
circle here that means that was the top
feature and then you get down to the
smallest Circle which is elsewhere you
know top five features
um so one way to think about this is if
we look at the USA the top features that
were elected were two crop models so
that's probably a good sign for the crop
modeling Community the the machine
learning model said let's start with the
crop models and then augment more
information but what they choose to
augment is the mean precipitation
they've added information about the
total rainfall which we understand to be
a way of representing that 1993 flood
that the models are missing they've
added additional information maybe that
very heavy rainfall season shows up
through that characteristic instead and
then the final one up here there's a
little bit on the number of wet days and
uh Frost as another thing that maybe the
models are not capturing well enough
another example here is South Africa the
number one feature is a crop model but
then they need more information about
extreme heat and cool days so those are
those this is directly pointing us to
where we need to improve our models
I already mentioned uh we have to think
about food systems that means not just
the crops but the heat tolerance of the
Agricultural laborers we heard about
this from Robert and goladio yesterday
so I'm going to go fast
um the other message that I really
wanted to say loud and clear here today
is that when we form adaptations we are
not generically adapting we are
targeting some specific climatic impact
driver or some specific vulnerability or
exposure to a hazard or or something
that we care about so here is an example
of an adaptation that we've explored in
our models to that Growing Degree Days
the number of kind of heat units that we
get so this one is specifically
targeting the mean temperature changes
of climate change and what we've done is
we've looked all around the world at the
different seeds that are grown uh in
this case I think it's Maize that we're
looking at
and we have asked ourselves what is the
the longest growing variety that we can
find which means the most heat units the
most ready for a warmer climate and then
we've compared it against the number of
heat units that are typical for a
growing season in each part of the world
and what you'll see here is is in
oranges and reds are places where the
future growing season is so warm that
there are no seeds today that can
actually meet that demand there's no
genetic material out there that we can
use to have the same growing season at
the warmer climate and you'll notice
that this is not the same map as a mean
temperature map because what people
don't realize is that the United States
here is a very productive region not
just because we have a nice temperature
but we can grow out in the field for a
long time we can spend a long time out
in the field collecting that Sunshine
making better grain but when it gets
warmer that means that the United States
agricultural Zone has more days to
accumulate that heat and therefore it
has a stronger impact than a place with
a shorter growing season so this
combination of length of the growing
season and the growing
temperatures combined with genetic
information this is really I think very
fascinating stuff
um the last one I'm going to show here
as a scientific plot I believe uh is is
thinking about how the global economic
models uh view this same problem uh this
is a very dry figure but I will talk you
through it
um we have several different variables
on the on the x-axis here and uh what
we're plotting on the y-axis is the
change in 2050 of a climate scenario
compared to a future where there is no
climate change and what you'll see is
the first thing that comes in is this
variable called y EXO for exogenous so
this is what comes from the crop model
and basically says here is the yield
change that the crop models predict and
the very first thing that the economic
models do is respond to that by saying
well if the yield is going down
dramatically here they're not going to
grow it anymore they're going to move
the agriculture somewhere else so that
the economic models reshuffle
agriculture internally so the actual
effect on the agricultural production is
less than what the crop model say
because they've they've optimized just a
little bit so the actual Crop Production
changes show up in this one and you can
see it's less
then what happens is in response to the
lowered uh agricultural yields they have
to expand the agricultural area that's
what this is this is that that
reshuffling has caused new area to be uh
brought under cultivation which leads to
other questions about ecosystems and
other things you know that that we know
encroachment can cause
um in general that allows us to maintain
production which is necessary because
the consumption demand stays very strong
we have to meet that consumption
um that can show that can cause big
changes in exports and imports and
overall the price increases so this is
the overall story yields change we have
to shift the production regions we have
to expand area to to maintain that that
same total amount of production to meet
higher demands that's going to require
new trade and generally higher prices so
this is the kind of thing we're building
in our models
um and yeah so it's not just climate
impacts it's also things like land use
dietary demand trade policy food waste
on the field and Beyond and then the the
role of Agro technology
um so one of the the major efforts that
we do within agnip is we work with local
stakeholders to develop scenarios of
future agricultural systems so here are
uh some of our stakeholder engagements
in different parts of Africa and the
overall approach that we're taking is
that we assess the climate change risks
and engage the stakeholders and say you
know are you preparing for warmer
temperatures different types of drought
uh you know higher carbon dioxide
environments that usually gets people's
attention and then we can have a
discussion where we think about what the
future
agricultural pathways are for a region
that's another way of saying how will
agriculture develop so that you know
here in Italy will they still be growing
the same Foods in the same ways in 50
years we could have that conversation
and build a scenario of agricultural
change even before we bring in the
climate itself
once we have the the system changes and
the climate changes we can design
agricultural adaptations especially
packages so not just one at a time but
multiple adaptations and that allows us
to run through models and evaluate the
impact and come back to the top and loop
through this several different times so
that we can iterate and make the best
adaptations and then of course in the
end we're discussing with with the
scenario and policy process
all right so last slide I have here is
just a summary uh hopefully I've shown
that agriculture is responsive to many
climatic impact drivers and we're only
tracking a subset we need to do better
and more and that requires better models
but also fundamental agricultural
research and experimentation
um the modeling approaches allow us to
capture specific responses and
adaptation options
and as I said we need more more data
more models
um adaptations are targeting specific
climatic impact drivers and we need more
work to identify the specific indices
and thresholds and adaptation
technologies that move our tolerance
around
and that we need to have this
co-development process to really make it
all work and I think with that I'm on on
my schedule here so maybe what I'll do
is I'll take just any burning questions
in the room before we move on to the
next speakers
any questions
[Applause]
thank you very much for a nice
presentation I have a question about
your crop model
ah is it include the other factors that
could affect the crop yield like
the the quality of seed or soil moisture
content availability and
pests and diseases and also the land
area I mean
in few cases we have a larger area for
for example a specific yield and then
after that after few years the farmer
changed their mind yeah and they they
harvested another crop so we we tend to
um
to use maps of crop areas and estimates
of crop areas so that is it's not
predictive as much as we we track and
try to follow there are it's basically a
different type of modeling that that
would help us understand why the farmer
made that change and the behavioral
aspect of that when you ask how many bad
years would a farmer need before they
change is very unknown I think that's
something that people really don't spend
enough time thinking about and and we
need to do more
um soil moisture yes we handle that we
can do better but we do have soil
moisture as a fundamental property of
the model pests and diseases we have a
whole agnip team working on that but
it's very very challenging because there
are thousands of pests you know worms
bugs you know insects things like that
and then pathogens there are thousands
of those and then when you combine them
with every crop species now you have in
combination even more so we're
developing generic ways that we can say
that we don't have to characterize every
single insect but you might characterize
the way they attack the plant are they
attacking the roots or the leaves or the
stem are they eating the the live fruits
or are they eating the flowers like that
kind of thing we can we can figure out
um I think I answered the question but
let me know if I missed something
Erica question up here yep
and I need to figure out how to get back
to zoom so I can see oh thank you Alex I
just wanted to know like you know
there's another Factor uh nutrients
availability in the soil so is it
possible to like include that as well
nutrients availability yeah and yeah
sorry I just remembered the other
question was the quality so I want to
come back to that okay and um there
there's another Factor like of when you
you were saying like uh the uh changes
in um crop type like people were maybe
uh cultivating some some other crop and
then later they are transferred to
another crop so in that case is it
possible like um maybe there are some
social economic factors because I have
seen in my country that people used to
like uh cultivate rice more but then the
prices of maize when their cell Maze and
they get like better price so they
shifted to Maize so uh they're like
factors like socioeconomic factors so is
it possible to include those as well or
have is this been considered yeah yeah
thanks for the question so um in terms
of the nutrient quality of the soils yes
we we do track that
um the soil databases can be good or bad
but we are generally able to find soil
information
um and then monitoring the long-term
soil health is a challenge but we are
trying
um and uh you know soil ecology is
particularly challenging but we have
nitrogen phosphorus potassium those
types of things and that does affect the
the quality of the grains uh the grain
quality also depends on carbon dioxide
concentration so we know that there are
are things like that but in general we
do a better job with cereal crops than
Plantation crops like you know fruits
and and grapes you know things like that
where the quality is more important than
the the quantity
um and then uh your other question about
the the economic side you know we do
have Farm household models that are
looking at the overall economic net
returns
um and we are trying to track other
trends like in your country there's you
know the introduction introduction of
irrigation means the whole borrow season
is now fair play right and if you're
growing rice then you can grow other
crops in different times so we try to
follow those changes
and there's a question online yeah
all right looks like Vincent has asked a
question here
um it's an observation
I've been to do you want to say this out
loud rather than me try to read it here
oh sure
can you hear me yeah please go ahead
yes I have an observation from you
earlier statement he said that when it
comes to a adaptation
we are not really adapting but
delegating a specific CID
but while working with you from where
you've shown that we're working with
some communities in Senegal and I think
in Mozambique basically it's like you
are coming up with a package yes of an
adaptation
so my concern don't you think that is a
contradiction when you you are talking
about adaptation and when you are
working with the community
yeah that's a good good question and
yeah so when we do an adaptation package
typically there are several elements
that that show up in an adaptation
package it could be a change of a system
where basically there is a determination
that a crop is is no no longer as
suitable or likely to have a strong
economic return as something else so you
want to shift you know towards a ground
nut system or towards something else
um but the other thing is if you are
using some kind of improved drought
resistant variety or some kind of
improved uh Growing Degree day seed
selection the the company that's that is
making that or the the government
subsidy that is enabling that may also
couple it with a different uh fertilizer
or chemical regime or may couple it with
requirements around planting dates or
some kind of uh crop insurance or who
knows what but the idea is they are are
trying to change multiple elements of
the economic system but but each element
is still oriented around specific types
of extremes but I think it's a fair
point there which is to what level does
the package blur those lines is
something we should track more thank you
for that point
all right I one last question and then I
want to make sure we get to our other
speakers
um I I'm just curious if uh you also
consider companion cropping like there
are some things like a climate adopted
companion cropping yeah so so there's a
broad category that I'll call
multi-cropping uh that includes uh
intercropping where you have multiple
crops on the same field and then
sequences of crops
um and we are looking into some of those
but but that is also quite challenging
and maybe I'll just say one last word
and you can call it a little bit selfish
if you if you'd like but the overall
level of investment in the crop
Community is much much smaller than the
level of investment in something like
the climate community so as the overall
focus of the attention moves from the
climate questions towards the climate
impact questions and the interventions
the adaptation we need a little bit of
rebalancing so that we can get the
models that that can actually do some of
these things that we're asking because I
think the attention is calling you know
shedding light on on some of these areas
that we need better models but they
won't just appear if we ask for them we
have to make tangible Investments to
make that happen
all right thank you for that let's uh
let's go on our next speaker is uh
Benjamin Sultan
um and uh he's right there to get
started so Benjamin I'm gonna hand it
over to you thank you for