Video summary
The July 2026 Agricultural Market Situation Outlook Webinar provided a comprehensive analysis of North Dakota's agricultural landscape amidst significant global shifts and geopolitical tensions. Key drivers for the month included favorable US weather boosting corn and soybean production, while escalating conflicts between Iran and Israel disrupted shipping through the Hormuz Strait, and ongoing war in Ukraine damaged grain infrastructure. In the wheat sector, total production estimates came in lower than expected due to a 4.5% reduction from record spring yields and tighter winter supplies, particularly for hard red varieties; however, ending stocks remained stable as increased feed utilization offset reduced ethanol consumption. Crop conditions were generally favorable with corn ratings normal and soybeans slightly above the five-year average, though harvest progress varied by region depending on critical late-summer weather patterns.
Livestock markets faced a unique mix of record highs and seasonal volatility, heavily influenced by external factors such as Middle East uncertainty and regional droughts affecting herd expansion in Texas and North Dakota. Fed cattle prices reached historic levels before experiencing a typical post-holiday decline, while feeder cattle cash prices remained resilient despite futures market fluctuations driven by packing plant capacity issues like strikes at major facilities. The domestic lamb sector continued to thrive with supplies remaining short against strong demand, trading significantly higher than the previous year. These livestock dynamics were further complicated by drought conditions impacting nearly 45% of the US beef cow herd and ongoing logistical challenges in processing plants that constrained supply chains across the region.
Innovation within the bioenergy sector emerged as a major highlight, with global ethanol usage expanding despite regional conflicts through new mandates in Brazil, Indonesia, and India. A particularly significant development was the first wholesale use of sugarcane ethanol as marine fuel for maritime transport, demonstrating a strategic shift toward enhancing energy security using renewable sources that could eventually penetrate up to 10% of the massive global marine market valued at over half US gasoline volume. Policy updates from the USDA also clarified technical guidelines for greenhouse gas emission scoring under Section 45Z, mandating mass balance tracking methods that physically trace crops like canola and corn from field to fuel producer rather than relying on flexible book-and-claim systems, thereby setting new standards for carbon intensity calculations based on federal insurance data.
The webinar concluded by emphasizing the interconnected nature of these markets, where energy prices directly influence grain costs through commodity index funds holding substantial energy exposure, creating a complex web of economic dependencies that farmers must navigate. While current market conditions present challenges ranging from geopolitical instability to weather-dependent yield variations, the sector is adapting with new biofuel applications and resilient livestock pricing structures that reflect both supply constraints and robust demand. As discussions continue regarding future policy changes and logistical adjustments for converting export-grade ethanol into bunker fuel at Gulf Coast ports, stakeholders remain focused on balancing economic benefits against environmental goals set by international aviation and maritime organizations to ensure a sustainable path forward in an increasingly volatile global environment.
Read the full video transcript
[music]
I'd like to welcome everybody to the
July 2026 edition of the NDU Extension
Agricultural Market Situation Outlook
Webinar. Uh my name is Dave Riplinger,
bio energy economic specialist with NDCU
Extension and the regular host of the
webinar. Uh this webinar is a regular
program of NDU extension. We're
targeting farmers and other aggra
business professionals who want to know
more about the current and possible uh
market conditions and how they might
impact North Dakota's economy. But with
that, I'll go ahead and turn it over to
Frank.
>> All right. Fantastic. Thanks again
everybody. Uh so today I'm I'm
broadcasting from May not uh yesterday I
was participating in the North Central
Research Extension Center uh field days
and gave a brief market update there.
So, I'm I'm still on the road traveling
um and and in broadcasting from why not
today. Um here's my contact information.
If you do have any questions or anything
later on you want to visit about
privately, I'd be happy to do that. Um
so, let's just dive right in. I do have
quite a bit of of stuff to cover that
things are changing pretty rapidly and I
want to make sure that we we get a
chance to visit about it. So, just a
real quick overview and summary. Um the
July WASADY or the world agricultural
supply demand demand estimates and the
production report uh were supportive for
corn and soybeans as well as for wheat.
Uh we'll go through those numbers in
just a little bit. There wasn't any
really dramatic changes uh but they were
all of the changes were supportive to
prices. Uh weather conditions have been
favorable in general for most of the US
corn and soybean development. Uh, I'll
give you an update on where that's at
and and some some ideas on on things as
we move forward. Um, obviously there's
been a reescalation in the war with
Iran. Um, the shipping delays through
the straight as Hormuz continue to be uh
indirectly impacting grain prices. I'll
show you some some kind of graphics on
on what's looking what it's looking like
right now. Uh and then also the other
thing that's been hitting the markets
and especially supporting the wheat
market is Ukraine and Russia have also
intensified their uh conflict um and
there's drones and bombing going on
that's now damaged some ocean vessels uh
in particular some Russian uh oil
vessels um as well as some port
facilities and some of the damage done
to the port facilities in both uh Russia
and Ukraine have been uh been attached
to or part of the the grain delivery
system. And so this is now creating some
shipping challenges, a lot of
uncertainty and some anxiety about what
that might mean moving forward. So that
with that, let's jump into the wisdom
report. Those two came out at the same
time. Um we'll start with wheat. So uh
we're in the stage of the year now where
we're getting wheat updates for for uh
for yields uh not so much for planted
and harvested acreage, but total
production. Um this is a breakdown by
class of wheat. First on the left hand
side you look at all wheat and we start
looking you know looking at the subasses
in a minute. As usual what I've tried to
do is provide the the first row of the
top row in blue being what the the
average trade estimate is. What is the
trade expecting to see? Um this is done
through a survey of private analysts and
forecasters. Um and so from that survey
of results we have the highest trade
estimate, the lowest trade estimate and
then the average. So the averages on top
and blue towards the bottom and the
highlighted black row is last month's
numbers and then the red number on the
very bottom is of course the number we
got from the reports. So what I usually
recommend to people is that they compare
the blue blue row to the red row the top
row versus the bottom uh simply because
that's what the trade was expecting and
if if the actual numbers were
dramatically different from what the
trade was expecting we usually get some
kind of price movement. So for the all
wheat number um the the trade was
expecting some reductions. The the total
reductions in all wheat wasn't quite as
great as what they had expected but it
was still definitely reduction. Um then
from all wheat we break it down into all
winter wheat. Uh that would be both soft
red as well as as a hard um hard red
winter. So if you look at all winter
wheat again it was down from what the
what the trade was expecting as well as
down from last month. Again, not
dramatic adjustments, but it's it's a
tightening up of that production side.
Most of the, you know, kind of the the
problem or the issue as well as the
reduction in production has come from
the hard red winterw wheat area. We're
starting to get much more solid yield
reports coming from the winter wheat
harvest. Um, I'll show you the wheat
winter wheat harvest progress here in
just a moment. Um, you know, general
reports out of the hard red winter wheat
country is that it yeah, it's very
variable. uh some farmers are having
normal or very close to normal yields
while others are having complete
disasters. So, it's it's very patchy and
very spotty. The soft red winterw wheat
area, which is really in that southern
Illinois, Kentucky, Ohio region, there's
some up into Michigan. Um the yields
there are are better. They haven't been
damaged nearly as hard as uh from the
drought conditions. Uh but production
did go down a bit from last month and
the trade was expecting a slight
reduction, which is what we got. uh the
white wheat which is primarily growing
up in the northwest uh Pacific Northwest
area uh was they were expecting a slight
a slight drop. We we basically unchanged
in the in the white wheat uh in
especially white winterw wheat area for
other spring which would include
primarily spring wheat. Um you know we
didn't have an estimate from last month.
So July is the first time that we got a
formal estimate for for spring wheat
total production. um that 470 million
bushels um is about a let me look at my
chart my graphics here is about a 4 and
a half% reduction from last year. Okay.
So, you know, we'll continue to watch
this as it develops. Uh but there was a
reduction and part of that of course is
planted area was down some as well as uh
yield estimates from last year. So,
Durham uh very similar to what we had
last year. Excuse me. It's a little bit
lower than last year. I apologize.
There's about an 18% cut from production
last year versus the current forecast.
Um there aren't a lot of private
forecasters that estimate Durham and so
I wasn't surprised to see that the trade
estimate and the actual numbers were
were were actually in my opinion pretty
close. Um there were some differences
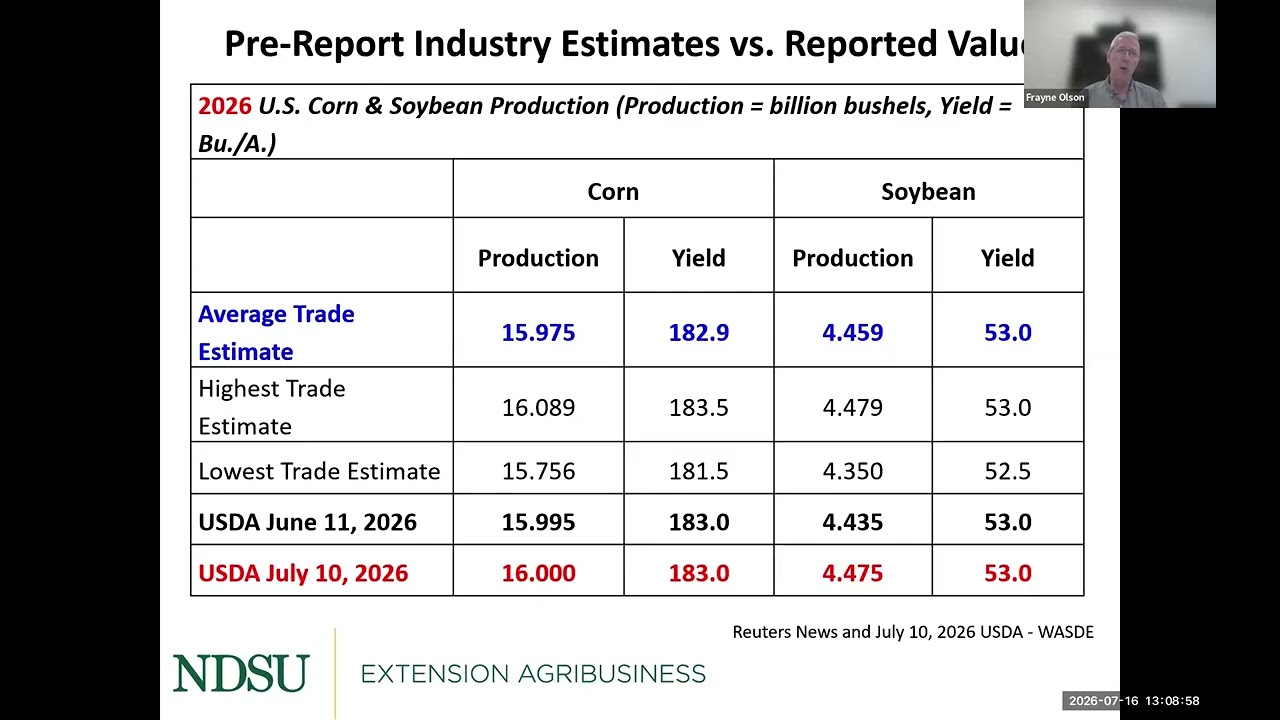
but pretty close. Moving on to corn and
soybeans. Again, we got an update in
corn production and yield estimates. We
weren't expecting any kind of yield est
yield adjustments. That will come in
August. So the August WASDY and the
August production reports are going to
be uh watched very closely. It's the
first time we'll get some updates to the
corn and soybean numbers on on the yield
as well as uh planted acreage coming in
from the FSA estimates. So we weren't
expecting any major major changes in the
in the production numbers. Um the
adjustments that were made were were
because of slight adjustments in the
June uh perspective plantings report. So
we knew that those acres were going to
be accounted for. So again, the the
industry number and the actual number
were very very similar. On the soybean
side, same kind of story. Uh we were
expecting a slight increase in total
production simply because we did have a
few extra acres planted. Um so again, no
no big shock or big surprises uh in in
the corn and soybean numbers. Moving
back to the ending stocks, we got right
we're at the funny time of year where we
have both uh old crop ending stocks as
well as new crop. So we got two
marketing years that we're still kind of
monitoring at the same time. Now
technically the uh wheat marketing year
has ended. Um USDA has made some the
final adjustments now to uh to
consumption and ending stocks. Um so
from now on now moving forward the the
92 million acre 90 92 million bushels
excuse me will be the number that we use
moving forward. So there were a few
adjustments just to um the adjustments
really came in some some tweaks to the
seed feed and residual numbers and again
th those are just some rebalancing based
on the information we got. The same
thing happened for corn. So at the end
of June we got the the uh um grain
stocks report um and based out the grain
stocks USDA did make some small
adjustments. They increased the feed
utilization, the amount of corn going to
the feed pile by about 150 million
bushels. So by increasing the feed
consumption, we they did reduce the
ethanol consumption just slightly about
25 million million bushels. So a net net
increase in consumption of about 125
million metric ton not million metric
ton 12 mill 125 million bushels which
then came out of ending stock. So the
adjustments in the corn utilization is
primarily because of the updates that we
got from the information in the the
quarterly grain stocks reports. Um on
the soybean side u we really didn't have
much of an adjustment. There was a
slight increase about a 10 million
bushel increase in USDA's forecast for
total soybean exports.
Again not a big adjustment. It wasn't
really enough to move the marketplace.
We were expecting some of those numbers.
[gasps]
Moving on to the new crop. So this is
new crop ending stocks. So now we're
going to take into include some
adjustments in the production numbers as
well as some adjustments in consumption.
Again the trade was expecting for wheat
a reduction in total ending stocks for
all wheat. Uh again mainly because of
the reduction in cut in winter wheat
production. We did get that. Um it
wasn't quite as large as what the trade
was expecting but it's very very close.
So again the numbers that came in uh
from USDA versus the trade were very
close. Corn there were a few surprises
in the corn ledger um mainly on the
consumption side. The exports number was
increased by about 50 million bushels
and again we had the increase from old
crop. So just remember in the WASY
report the old crop numbers the ending
stocks for old crop become the beginning
stocks for new crop. And so by reducing
the old crop inventories that meant that
we have fewer bushels coming into the
system from last year and those bushels
then flowed through to the bottom line.
So most of the adjustment this reduction
that we saw from what the trade was
expecting versus what we got actually
came from adjustments in the old crop
numbers. And then on the soybean side uh
again really everything was kind of a
wash. There was some adjustment. There
was a few increases, a few decreases,
but everything basically washed out at
the bottom bottom line. Again, not
necessarily shock value in the
marketplace, but all of the numbers that
we got were supportive to to prices.
Um, South America, we really didn't get
any kind of adjustments except for the
forecast for Argentine corn production.
That did go up by about 2 million metric
tons. Um, again, we were expecting that
to happen. um private estimates that
were were coming out of Argentina. The
corn crop looks a little bit better than
we had first expected expected. Um in
for Brazil, no changes. Again, this is
the crop that they just uh uh have
basically um are finishing harvest. Now,
we do have some second crop corn safrina
corn crop in Brazil that has to be uh
harvested yet, but we're getting some
yield reports out and it looks as though
the the expectations in the marketplace
are being met. So, let's move to crop
condition. Um, I pulled up a little bit
different way of presenting the crop
condition reports. This is also reported
by USDA. You can look this up and and
and search it yourself. On the very top,
this top pane is what is the condition
or what percentage of the crop is rated
good to excellent. And if you if you
listen to the radio, a lot of times they
say, well, what portion of the crop is
rated good to excellent? This shows the
weekly numbers. That's the the line for
each of the other previous years. And
you can see where 2026 is here. This
dotted line that runs down is is the
most recent date, which would be uh July
12th. This comes out every every uh
Monday uh Monday afternoon. So for 2026,
the corn crop condition ratings uh this
time last year were much higher than the
what we're seeing today. Very close to
what we saw in 2024. If you do notice,
by the time we got into the harvest time
period in 25, those condition ratings
had dropped a little bit. So the moral
of the story is corn condition ratings
right now are pretty favorable. Uh
they're pretty much you know in in a in
the normal range. You can see in this
what portion of it falls into each of
these categories. And you can also see
towards the bottom as far as the crop
development where just just towards the
front end of the silking or the the poll
of the u yeah the silking stage where
the the silks are actually coming out
and pollination is beginning. for
soybeans. Um kind of a similar story
when when we look at 26 2026 condition
ratings. A little bit lower than what
we've saw saw over the last couple
years, but definitely above or kind of
yeah, slightly above the 5-year average.
We're not that far off the midpoint. You
can see also towards the bottom that
we're about 40% bloomed right now. Uh
which is pretty good uh typical
progress, actually a little ahead of of
normal progress for crop development.
So, we're now getting into these the
point is we're getting into this really
critical reproductive phase for both
corn and soybeans. The weather
conditions into late July and into
August are going to be pretty critical,
everybody's going to be watching what's
going on very very closely. So, if we do
have some sparks in the market, some
weather related rallies, you know, my my
recommendation always has been if you
see that kind of of of of occurrence,
please take advantage of it from a
pricing standpoint.
For winter wheat, I just wanted to
update everybody. The winter wheat 20
2026 winter wheat conditions have been
miserable uh all basically all season.
Um the reason for the gap is this is
during planting and then we have the gap
for the winter and then once it breaks
dormcy. So you can see we're about 2/3
harvested. Uh the hard red winterw wheat
area uh is about 2/3 harvested. The uh
soft red winterwheat area is about 73
74% harvested. So, still have a little
bit of winter wheat in the northern uh
area. We've got into Montana as well as
Pacific Northwest left. So, most of the
Kansas crop is is being completed now.
We're wrapping up in uh in Nebraska and
Colorado.
For spring wheat, um notice the 2026,
the red line up here towards the top. Uh
we're right in the middle of the 5-year
average uh for for uh crop ratings.
definitely down from 24 as well as 22,
but we're above last year's numbers. Um,
as far as p development phase, uh we're
in kind of in the middle towards the
tail end of the heading. Um, and and we
should be starting into the flowering
stages pretty quick here. So again, crop
conditions are going to be uh weather
conditions are going to be pretty
important for um for seed development as
we move forward.
Let me move into some of the issues with
the war. I just wanted to to give you a
a geographic picture of what's going on
in this interconnection between what
happens with the grain markets as well
as the energy markets. So this is a map
that shows where is the winter wheat in
Russia produced. So the darker the
areas, the more more tons or bushels of
winter wheat that are produced. And you
can see here's Ukraine. Over here on the
left we have the Black Sea towards the
bottom left hand corner. Over on the
right hand side we have the Caspian Sea.
And this this little uh kind of this
little side area is called this the
Azovv sea or sea of Azov.
Okay. Um so you can tell and most of the
win most of the wheat that Russia
exports is the winter wheat. The spring
wheat production region is much more
along this this vulga and eurals and
into the Siberian region. So it's more
along this border with Afghanistan.
So the winterweed is really the one that
gets exported pretty heavily. You can
see these there's a series of rivers and
I'll show you those in just a minute
that are very very critical and
important for getting that winterweed in
in Russia to port very very cheaply,
very inexpensively. So again, just for
for geography, here's Ukraine, the Black
Sea, Russia, and this is the Sea of
Azov, and then the Caspian Sea over
here. So here's a map now. Here's the
Black Sea on the far right hand side
would be the Caspian Sea, and here's the
Sea of Azov. So you got two major rivers
that are used for transporting grain.
The Dawn River which is right here and
this this shaded area is kind of the
drain field for that. And then you have
the Vulga River. Now the Vulga River
flows in the Caspian Sea. It it winds
its way all the way up towards Moscow.
And there is a canal that's been um
that's that's been um basically
excavated cut excavated that connects
the Vulga River to the Dawn River. So
when it comes to grain transportation,
they have some flexibility and it's
actually possible to get um some of the
product here in that's delivered or
shipped across the Caspian Sea along the
Vulga through this canal along the Dawn
River to a key port here which is called
Rosttov on Dawn. So it's the city of
Rosttov on the Dawn River. And this port
right here was one of those that was uh
that was attacked and had some some
damage. Now again, a lot of the damage
that was done was to some of the the
general port facilities, some of the uh
energy loading facilities, but also some
of the grain loading facilities. So this
port right here is very very important
and critical for the Russian wheat
delivery. About 25% of the Russian wheat
exports come through that particular
port. So the fact that this has been
damaged now is is important. I just
wanted to show you some of the kind of
geography what's going on. [snorts] Now
this region also becomes important when
it comes to energy and energy transfer
as well. So I'm going to talk about that
in a minute. So this is a map. I I kind
of blew this up a little bit. That's why
the resolution isn't the greatest. Um so
just for geography again up here we have
England. This is the Mediterranean Sea.
This is the Black Sea right here. This
would be uh parts of Ukraine. This would
be Russia. Here's the Sea of Azov that I
just talked about. And here's the uh
Caspian Sea. So these little dots
represent um vessels carrying petroleum
products, crude oil, uh natural gas,
gasoline, diesel fuel. And you can see
the little dots here that are up river.
So there are some transportation along
this both the Vulga River and the Dawn
River for energy as well. You can also
see that there are some of these
facilities along here that are that are
I mean the vessels here that are also
carrying uh energy products back and
forth. Okay. Now here is the Red Sea and
this is the Suez Canal. Over here on the
right hand side this is the Persian Gulf
and this is the straight of Hormuz.
Okay. So you can see all of the oil
movement that comes through this
Mediterranean region. Now, the reason
that's important is because now as we as
the the um straight of Hormuz gets gets
plugged up again and there's some
concerns about what the flow rate of of
vessels will be, um the Iranians are
also uh asking the Houthies or um
requesting the Houthis to be able to try
and block the exit to the Red Sea down
here. And so if they can do that, now
you have two major uh flows, two major
kind of transportation routes for crude
oil that potentially have high risk um
transits. Okay. So you have both not
only the Persian Gulf but now also if
the Houthis are able to to slow or stop
traffic on this um at the outlet for the
Red Sea could also be a significant
issue.
Now a lot of times we most of the focus
is on energy. I understand that. Uh but
the the shipping uh congestion that goes
on through the straight of Hormuz. So
again, this is the Persian Gulf. This is
the straight of Hormuz. You can see all
the vessels that are backed up on either
uh on the outside wanting to get in, get
reloaded, or on the inside that are
loaded and wanting to get out. So the
red dots, uh the excuse me, the the
maroon dots, get it right. the orange
dots, excuse me, the orange dots are for
um
the the energy products. Um let me
oh uh the the blue dots are for for um
container vessels and then the green
dots are for other cargo vessels. So we
have a lot of product that's flowing
through that that straight and it's not
just the energy markets. Okay, let me
continue. So what does that mean for
pricing? And we've seen some some
rallies in the in the grain markets um
primarily because of some of the
connection into energy, the concerns
about the transits in the in the Persian
Gulf. Um you can see that that this was
the runup that we got during the first
part of the Persian Gulf War. This is
the drop that we had um as as things
began to settle and now we've get a
recovery. Now again, this recovery is
not 100% due to the the issues with
Iran, but it's certainly providing some
supportive uh uh pricing and a lot of
that is the is the money flow. people
that are exiting and getting out of some
of their positions in the stock market
because the stock market has been
softening. Um transferring those monies
that that um that those funds over into
commodities primarily the energy stocks
but a lot of the the commodity I mean
the the people that are trading in the
in the stock market often do not
directly invest in the the uh energy
markets. they they like would prefer to
buy a commodity index or an index fund.
And so those indexes are prepackaged,
meaning they're a blend, a prepackaged
blend or portfolio of commodities. And
about 50 to 60% of that is energy. But
by buying those indexes, you're also
getting um grain in the form of wheat uh
corn, soybeans as well as the meat
products. So there's a connection not
only through ethanol but also through
this investment community and this rally
some of the support that we're seeing in
the excuse me support that we're seeing
in the in the futures market for corn is
also uh a spillover effects because of
the investment uh um issues going on to
soybeans. This is November soybeans.
We've seen a nice rally or pop in the
soybean market. Part of that is is the
Middle East issues, but a lot of that is
actually because of of China coming in
and buying some US grain. Now, US
soybeans specifically. Now, China, I
want to be very clear, China has not
purchased, they purchased soybeans.
It's primarily for new crop, not old
crop. And these purchases are very
typical. And that's the point I want to
make is that the volumes they're
purchasing and the timing of these
purchases are very common. They're very
typical. This is usually what we would
see at this time of year. So, the reason
the soybean market is now being a little
more supportive is is primarily because
it's there were still some concerns.
Would would China follow through on
these promises to be able to buy uh come
back and buy US soybeans like they have
in the past. And so, some of that
anxiety is starting to wear off and
excuse me, if China does continue to buy
at these rates, that would definitely be
positive. it would be back to their
normal purchasing habits
on the wheat. Uh you know wheat has
really taken a beating over the last
several from from basically from
planting into the first part of July.
Some of this rally again it's a
combination of two things. Num number
one we're seeing um a slightly smaller
winter wheat crop. Um winter wheat
futures markets are actually above
prices are actually above spring wheat
futures prices right now. Uh some of it
is is a spillover effects from the
Iranian war. Uh but a lot of this a lot
of especially over the last about two
weeks has been because the escalation of
the war between a um Ukraine and Russia.
And so some of this again is very
supportive. It's politically driven.
It's it's world trade driven. And so we
got to be very careful about um not not
getting too excited. And my my best
guess right now is for all of these
major commodities that we will not see
the spikes and the price levels we saw
when the when the Iranian war first
began, but it's definitely been
supportive. So, I'm hoping that farmers
get a chance now, especially for corn
and for old crop corn and old crop uh
wheat to be able to get some of those
bushels sold and get that cleaned up. My
last slide and then I'll hand things
over to Tim Petri um is on canola. Um
we've similar to soybeans, we've seen
some some strength in the canola market.
A lot of that's driven by the oil seed
complex. Um the even though the um you
know on the Canadian side, the last stat
can report was showing that the the
production and consumption and ending
stocks this year are projected to be
very similar to what we saw two years
ago. And again, two years ago there
there was a reasonably tight canola
supply demand balance sheet. So, with
that, I will stop. I'd be happy to to
answer any questions when we get um when
we get a chance to at the end. So, I
apologize for taking so long. Tim, it's
all yours.
>> Good afternoon, everybody. Tim Petri,
extension livestock marketing
specialist. Again, like usual, not going
to change things up very much. Just talk
about the cattle market and a little bit
about lambs and what's going on there.
and really happy to follow frame because
many of the things he said are affecting
the cattle market as well. So, let's
move along. Usually, I do start off with
the cash market, but we're going to
start off with the uh box beef here. And
uh this this is what packers can sell
their meat to into the wholesale
channels or ultimately retail or
whatever. And there's been some noise
this week that you know that the cutout
value went down. In fact, it went down
uh $7
uh last week and uh so you know I listen
to the radio and so on like you do and
commentators oh you know the cycle is
peaked and all this noise and so on. But
I just want to assure you one thing here
in that the cutout value going down and
it's as we going to see in a minute
itffect affects fed cattle too because
there's a direct link there and what
packers can sell their meat for it or
what they can pay for producers. But I
just want to assure you that this isn't,
you know, some conspiracy to lower
prices or anything unordinary going on
because the cutout value usually does go
down and you see that on the chart. It,
you know, the last of three years and
now this year it does go down this time
of the year. It's a seasonal thing. We
get the Fourth of July. You know, it
peaks back
earlier in the year, right before the
holidays start with Memorial Day and
Father's Day and all those big beef
eating days and Fourth of July. But
after Fourth of July is over, we get the
dog days of summer now and not as many
uh gettogethers and holidays and so on
and again it's 100° out and humidity and
all that. So the cutout does fall off.
So this is you know not out of the
ordinary. It it but it does affect the
market and then you know you know then
by again by the time we get to the later
holidays get Thanksgiving out of the way
and you know get some holiday buying you
know that occurs. So uh but it does
affect the the fed cattle market as
we'll see. So, here is the fed cattle
price chart. Just to to carry on before
I explain in more detail, the fed cattle
market went down $7 last week. Went down
from 255 to 248. And again, if you know,
if you listen to commentators and you
listen to Chicago traders and so on,
it's you know, again, it's like the sky
is falling or something. But the cutoff
went down. So the Fed steer price went
down uh the same. And again kind of a
seasonal thing. And you look on the
chart that that happens as well. You
know, we're still at record high levels
on fed cattle up there at 248. And you
know, so uh uh you know, still above
last year. Uh now back to what FR was
talking about when we get into the the
the distant futures and you know that
would be you know we're we're moving
into our next our closest is August and
then October and then the December
futures are quite a bit lower than the
current cash market. Again the futures
market has fallen quite a bit. the
futures market uh you know and and and
compared to the cash market again the
cash market is 248 and uh August futures
are down there two 25 or something so
there's a big decline there and uh but
it's the just like fra talked about it's
the uncertainty in the market the funds
that he mentioned do not like
uncertainty and they're worried about
the Middle East and the gas prices were
up, then they went down. Now they're
going back up. Uh gas prices are a very
very component to, you know, to beef
prices because uh consumers, you know,
have to get their kids to to school or
to daycare and and people have to get to
work and so they have to have gasoline
to do that. And when the gasoline prices
go up, uh you know, they fill the tank
and then go to the grocery store. And
so, you know, that that that's can
impact beef prices. Hasn't had a huge
impact yet, but you know, the again the
funds are looking their their job is to
predict the the um or see what the
market will be in in the future. So,
that's all part of it. You know, the the
lots of other noise in the market
affecting the futures market. I could go
on and on and on. You know, the
president's talking still talking about
increasing beef imports and we've got
the new world screworm which so far has
not turned into a pandemic or anything.
We got fewer 40 40 cases and you know
seems to be you know you know somewhat
under control although we do have a few
cases in the US and you know we had
packing plants closed down and now the
Fort Morgan Cargill plant the employees
are striking. So then we lose packing
plant capacity and so you know that gets
the funds all all worried about that and
then like frame talked about we got
weather issues and corn issues you know
the price of corn as we'll see in a
minute affects Peter cattle as well. So
the the futures market there is risk off
quite a bit lower. Uh the WASDY report
that Frra mentioned last week came out
and the the prediction for this year on
the WASDY was still 251 for an average.
Then when we go to next year, those
orange squares in there are next year's
futures, which again are very riskoff
because that's a long ways out and a lot
of things could happen. But USDA
predicted even higher fed cattle prices
this year of or next year and uh you
know of of 254 a little above this year.
So you know we'll have to see a lot of
things can happen and there's a lot of
noise in the market and so on but as of
now we're still at record high prices
and that's been supportive to feeder
cattle. Here's our 550 to six weightight
calf prices again and usually as you see
on the chart this time of the summer
they just kind of level off. there
aren't very many being sold uh because
you know their calves are out sucking on
the cow and there just aren't uh many
calves being sold and the market just
kind of levels out there usually then in
the fall when the market when the calves
start coming to market it goes down I've
talked to this month after month before
that didn't happen last year it went up
instead of going down in the fall but
again looking at fed cattle prices and
and You know, I think maybe we might
return to a more normal seasonal pattern
this year and some decline in prices.
And again, it won't be any conspiracy or
anything else. It's a normal seasonal
thing. All those fundamentals that I
have listed up there that I've talked
about every time the last few months,
uh, you know, were in play and so at
least some of those may not be. And so
that could cause weakness. And I'm not
even going to show you the chart I
showed last time where, you know, we
could could to go down seasonally there,
but we're still $100 higher than we were
last year at this time at all-time
record highs. Still a really good demand
for for uh calves and and so on. Move to
the heavier weight yearlings. Kind of
the same story there is we're on, you
know, we're $50 higher than we were last
year. We've kind of been, and more on
this in a minute, we've had fairly level
uh prices there throughout the year. Uh
you know, not not a lot of variation,
but at record high levels. Again, the
futures have taken a hit. More on that
in a minute when I show you the chart in
the in the fall futures there, the
August, September, October, November
futures. The trading down there 335 to
345 in in that area. Again, for all
those reasons I talked about before, the
futures market has just got the jitters
and it's looking at the fed cattle
market and uh and so on and then even
risk off into next year as uh as well.
But uh you know getting just to get into
a little deeper of the situation there
uh here's the September feeder cattle
futures contract and then the CME cash
settlement price. You know, and I've
showed you I showed you this chart last
time as well. And you know, what we've
seen, of course, is a very volatile
futures market. You know, uh you know,
like I said, right down there around 345
today and and not much different than
the last time I talked to you, but it
went way up to 370 and back down to 345
in in and you know, in the last month.
And you know there's there's where the
futures were in May again around 350. In
April they were way up around 365 and
March we're down there at at 35
to 40 and so on. But like I told you
last time the and you saw how level
those uh 800 pound steer prices were
that cash settlement price which is just
all the uh uh you know 800 pound
basically average 800 lb steers sold in
in the US and this is daily. My other
chart is weekly. So, this shows you a
little bit more noise, but interesting.
Go across from 370. They're 370 today.
They were 370 in June. They were 370 in
May. They were 370 in April. And they
were 370 in March when the futures
market has been all over the board for
all those issues that that I mentioned
and and that Frey mentioned. So, you
know, I tell producers, you know, if you
want to get ulcers and lay awake at
night, watch the futures market. If you
want to sleep good at night and so on,
watch the cash market that has been has
been resilient there. And you know,
yeah, the futures market then has uh you
know, is not that much different than a
month ago, but it did go way up and go
down. Again, Fra already talked about,
you know, there's a opposite
relationship between uh uh corn prices
and and feeder cattle futures. Chain
corn 10 cents a bush will change full
cap price buck in the opposite
direction. So there I've just kind of
highlighted frame talked about why corn
prices have went up there and in July or
by the end of June and you see kind of
interesting at the low there at the end
of June and corn prices is the green
line that was the high in feeder cattle
prices. Now they've came down. There are
other factors affecting it too, but you
know, corn will be a big thing to watch
uh into the future here because it
certainly does affect both futures and
and cra cash prices for for cattle. So I
just want to mention that uh the July
1st beef cow inventory report down there
in the black towards the bottom, USD is
going to release the July 1st cattle
inventory report uh next Friday. And so
we're anxiously awaiting that. Again,
the the uh the uh July numbers have went
down for uh seven years. They didn't in
20 24 USD didn't do the survey because
of of budget issues, but they did last
year. So, we're anxiously awaiting that.
I think we'll be within 1% either
direction of last year. wouldn't
surprise me for him to be down a percent
or whatever or up a percent but we you
know we got to wait to find that out.
There's the website at the bottom that
uh if you want to get that report and
then next webinar I will report in
detail what that report said and the
ramifications what for what might happen
there it is dry we you know we don't
expect that that herd rebuilding started
at all again it depends on if they go
back and adjust numbers or whatever
there's the current drought monitor came
out this morning and a lot of cattle
country what you know is dry in, you
know, in Kentucky and Florida are the
outlying states are number nine and 10
and it's dry in both of those states.
And then of course the big states are
Texas on up through North Dakota and
Montana and and a lot of drought there.
Although Texas, which was very, very,
very dry just a month ago and now is
flooding and got all kinds of rain down
there. So they've improved a lot. But
down at below you see that 44% of our
beef cow herd is still in drought. So
that's limiting any expansion plans and
you know that's a short-lived recovery
in Texas. So you know I talked to my
counterpart down there just a few days
ago. He said you no big plans for big
you know heer keeping back and so on
because you know you remember just a
month ago it was so dry. So finish up
with lamb prices like I usually do.
again, they're just really really
plugging along nicely this year. Even,
you know, we've got short supplies of
domestic lamb and very good demand
there. And so again, in the lamb case
there, we're trading $100 higher than we
were and so on. So with that, I'm going
to quit and uh and turn it over to Dave.
>> Bio energy update. A lot going on.
Obviously, Frra's spoken quite a bit
about what's going on in the Middle
East. uh repercussions for energy
markets globally. Uh as we've talked
about uh regularly over the last few
months and you know actually over a year
we are having record uh ethanol exports.
Uh ethanol use globally is increasing uh
prior to the the conflict in the Gulf.
You know it was a it was a energy
security issue to some extent um as well
as you know looking for that most
economical affordable way to to have
fuel in different countries. I'm going
to go through a few different stories uh
internationally just to kind of
highlight uh you know what's going on.
Uh start in Brazil. Brazil is a very
large producer and user of ethanol
number two in both of those categories
behind the US. Uh use sugar cane to
produce ethanol as you spoke about you
know earlier this year. There's an
interesting play between sugar uh prices
and ethanol prices um and also between
the price of oil uh and and ethanol use.
And here you know at the at the federal
level the national level in Brazil an
increase in the ethanol blend in
gasoline to 32%. And so little bit of
background in Brazil uh their vehicles
can run uh anywhere between zero and
100% ethanol. Um, and so these
adjustments are made, you know, by the
government and then when you go to the
gas station locally, uh, you know,
that's what you have. You have the
choice of E32 or E32. And of course,
this, uh, uh, somewhat a modest rise,
but again, a 32% blend uh, is is quite
substantial. Uh, you know, in the United
States, you wouldn't be able to do that,
uh, with with EPA regulations uh, and
the like, but you know, obviously Brazil
is taking that step. [snorts] Um, next
moving into over to Asia. Uh, in
Indonesia a few years ago they they made
this announcement that they were going
to uh you know
eliminate the you know the export of of
oil or control or palm oil exports again
to kind of keep things local uh to avoid
food versus fuel and the like. uh they
are not an oil producing country and so
they're they're now up to a almost B50
blend. So 50% of their their diesel you
know biodeiesel is is out there uh as a
home uh for their oil but again in that
case much more of a an energy security
play. uh looking at India uh India has
rapidly gone from having no mandate to a
20% mandate and in fact having excess
ethanol uh in their system
um which again a dramatic change. They
were very concerned with food versus
fuel as well as how corn and/or ethanol
exports might impact local production.
you know, kind of that that uh uh
individual farmer impact on having, you
know, access to these these markets
where, you know, the US might be a, you
know, be able to produce or supply at
much lower costs. You know, they've hit
and are now getting ready, you know,
exceeding that E20 level, uh, which is,
uh, causing some opportunities and also
some challenges. A big piece of news
there yesterday is they just had a court
announcement where uh someone
successfully sued an auto manufacturer
because their vehicle failed uh again
according to the court because it used
E20. Um that's kind of remains to be
seen. Uh little bit of a unique
situation there too. But you you know
you are seeing as a newer market as
things grow out that that's one of the
concerns a lot of folks have is you know
is this an acceptable fuel? you know,
does it cause problems? And in that
case, the courts uh uh indicated that it
does. Uh next, some really big news from
earlier this week. There's been a lot of
discussion uh and movement towards the
use of ethanol as a marine fuel, you
know, for for major uh international
maritime uh transportation.
Uh just this week we've seen uh the
first you know wholesale movement into
that market uh with a uh ship uh being
fueled in Brazil uh with half a million
gallons of uh in this case sugarcane
ethanol. Uh you can see that that
picture there is actually the picture of
the actual vessel itself. So, a recently
commissioned vessel that can run on a
conventional fuel, which would be, you
know, petroleumbased
methanol or ethanol. Um, and so a lot of
recent uh vessels that have been
commissioned can run on methanol,
consequently can run on ethanol. And
that's really kind of this this movement
that that we're seeing. Uh right now
there's about 70 vessels worldwide that
have that uh capacity with the
expectation it's going to increase quite
significantly in the next few years. Um
just thinking about the implications of
that the global uh marine fuel market
for for international trade is about 84
billion gallons. So a little more than
half of what the US gasoline market is.
So you can imagine a 10% penetration of
ethanol into that market would be
another 8 billion gallons uh of ethanol
use uh globally. So this has a lot of
promise uh for being a a growth market
for ethanol. And it's also interesting
too in you know terms of Brazil you know
at at the port in country you know
they're they have an abundance of
ethanol. So in many cases this could be
driven by economics or that you know the
financial bene direct financial benefits
at the same time for those
companies shippers
uh you know if they do have that that
interest in reducing emissions you know
having a a a shipment
fueled with ethanol you know may meet
some some future goals that they have.
Uh and just kind of expanding on that a
little bit, I've talked a lot in the
last few years about, you know,
international efforts in aviation fuel.
So we we talk about SAF, you know,
sustainable aviation fuel and uh AO,
which is the the international airline
uh organization. Uh the IMO, which is
the international maritime organization,
is also working to decarbonize. And so
this really fits within that that
broader kind of shared goal of the
industry. Uh and we'll see how that
builds out. It's also, you know, like
logistically a relatively
straightforward thing to do because, you
know, many ports. So for example, in the
United States, if you go to the the US
Gulf, uh you know, you have ethanol
available. So the challenge of, you
know, changing that from being a product
for export to a bunker fuel, uh is
pretty straightforward. Uh last thing I
want to talk about uh is the recent
release of technical guidelines from
USDA for uh greenhouse gas emission
scores for egg commodities. So this fits
into the big 45Z
discussion. So, one of the things we're,
you know, we're waiting for is getting
all of the pieces, the final rules for
how farmers or how agricultural
commodities might be able to be
incentivized uh when used as a feed
stock for for bofuels or for lowcarbon
fuels. And so what the USDA just
released a few weeks ago is
guidelines for how this can be done
using uh a tool that they released
before. So that's that that carbon
intensity calculator uh as well as some
of the guidelines of of how you might do
how how they would like reporting how
they would like verification to occur.
It's a bit unique because USDA is not
the regulator for 45Z.
um that's the IRS. Uh but obviously they
have expertise that no other department
has and this is a contribution or kind
of you know solidifying of of part of
what we're going to expect uh for that
final rule uh when it's released. That's
again expected to be in November. Uh
another big piece that's important is
that it did add canola. And so these
were based on comments you know received
uh previously updated. So instead of
just having corn, soybeans, sorghum, you
know, canola is now a feed stock, which
is, you know, very helpful, promising
for them. Uh [snorts]
this is a really quick uh coverage. I'm
not going to go into it as if it's a
training. Uh but a screenshot of the
calculator itself. Very straightforward
Excelbased tool. uh
you know drop-own boxes in terms of
crops, the location and so you actually
specify the county uh and
some uh different pieces. So expected
yield, actual yield. This needs to line
up with what you report for for federal
crop insurance uh and then different
practices uh and the like. And at the
bottom it'll calculate uh the estimated
carbon intensity. Uh, and again, it's
important to note that doesn't
necessarily mean that that number would
be used by
the clean fuel producer and reported to
the IRS for 45Z.
But it's interesting because it's it it
would I'm challenged to think that it
would be much different. Uh, one of the
big uh, things that the
the technical guidelines that were
released a couple weeks ago do is they
do use mass balance uh, to to frame how
this is done. And so to understand the
difference between mass balance and book
and claim and if you don't know these
terms uh, now now's the first time to
give you a chance to understand what
they mean. So with mass balance, you're
really tracking the specific bushel of
corn or that that crop from the field to
the fuel producer. It has to be that
specific crop. So I want to know the
carbon intensity of that specific
bushel. Uh that's opposed to book and
claim which would allow uh
the farmer the bofuel company to not
actually exchange or track what's going
on with the physical commodity but
rather allow the farmer to sell credits.
And you know good way to explain this is
to think about a jar of candy and I've
got these different colors and some of
these colors are are more desirable than
others. Well, you know, you think that
there's this mix and there are crops
that have lower CI scores or higher CI
scores. Well, for mass balance, you
would have to actually have the candy
that has the low CI score. You know, if
if you needed 100 of those, all of them
would have to be, you know, traceable
back with that amount. uh for book and
claim, you know, person could say,
"Well, I've got, you know, 10 of them in
here that have this this this
attribute that you like that that you
think is good. I'll give you I'll sell
you the credit for those." Um, and that
that will take care of the transaction.
Again, it's not actually attached to
that physical uh in this case, piece of
candy. Um
a lot of and if you think about the the
benefits of that you know if I'm a
farmer a lot of most uh folks in
agriculture the biofuel industry would
like to use book and claim it removes
all of those costs and challenges with
preserving identity of traceability and
the like. U allows flexibility uh you
know and you know makes marketing a
whole lot easier. Uh but again, right
now with the the technical guidelines
released a couple weeks ago, they're
still on mass balance. I don't know if
that's going to change. I mean, there's
a lot of folks who'd love to see book
and claim uh for the reasons I just
mentioned. Uh but that happening kind of
remains to be seen. Uh so that uh is the
end of my presentation and the end of
our three talks for today. Uh we will be
meeting again in about a month on the
13th of Thursday. Thursday, uh, August
13th. Um, and with that, happy to have
any answer any questions or be engaged
in any discussion that you guys might
have. While we're waiting there, I don't
know if I made it clear, but another
thing I want to talk about on the
livestock market that I wanted to make
clear was, you know, there's still going
to be a lot of volatility because both
the feeder cattle and live cattle, the
nearby futures are August. And in both
cases, the cash market is over $20
higher than the current futures. So
either one of them's going to have to
change $20 or both change $10 or if the
market's going up or down or whatever.
So volatility is not over just because
that those you know that that uh basis
difference or that has to be zero uh
with the cash settlement price and the
in and the feeder cattle futures or the
cash price in and the live cattle in the
future. So hang on there's still going
to be volatility.
>> Is there going to be volatility in the
crops markets or where we get
>> Yeah. I I I think that's a pretty pretty
safe bet that that yes, we'll have I I'm
never going to work my way out of a job.
I think there will always be things to
talk about. [laughter]
>> All right. Well, and I I don't see any
any questions right now. Uh I I think we
provided everyone an ample opportunity
to do so. I want to thank Tim and Fra
for speaking today. We'll be back in a
month and I hope that everybody has an
enjoyable day and doesn't get too hot or
too smoked out. Thanks.
>> [music]